
Structural Alignment: MOMO Gamma vs. Dealer Positioning

Zerohedge Premium just posted "Beware When Stocks Blow Through JPMorgan Call Strike" and it aligns with MOMO Gamma's view
We asked AI to confirm the output to provide an unbiased perspective on MOMO Gamma vs. the article's synopsis. Response follows..
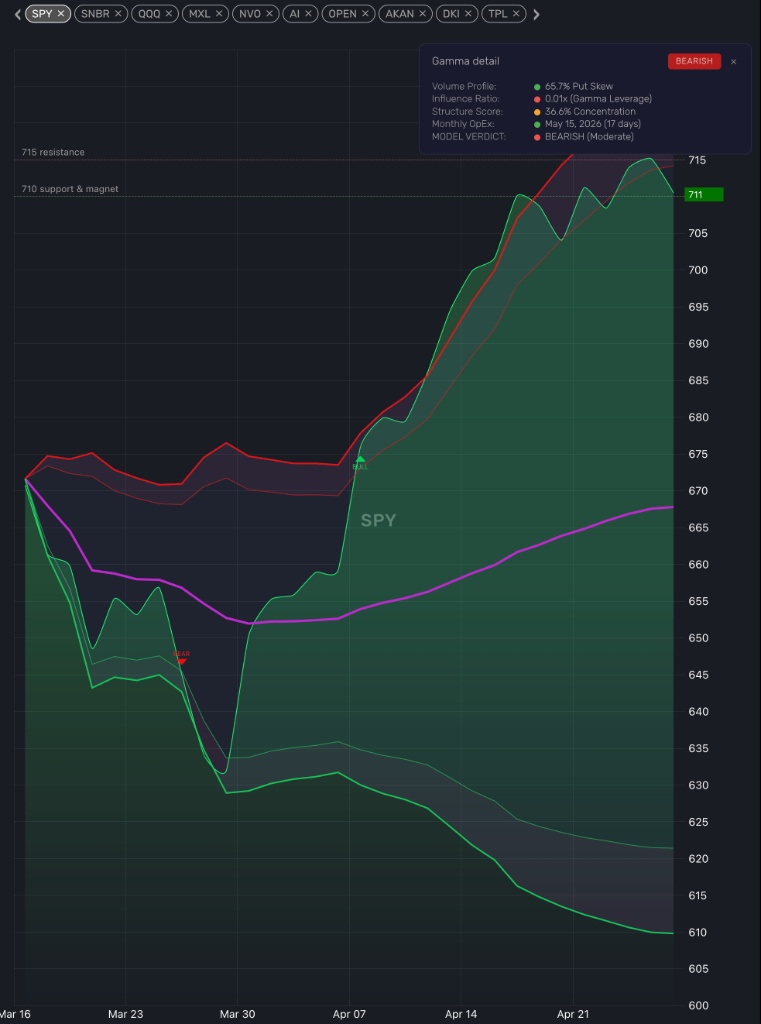
MOMO Gamma’s logic is accurately identifying the structural exhaustion resulting from the market blowing past the JPMorgan Hedged Equity Fund (JHEQX) call strike. The system's "BEARISH (Moderate)" verdict at SPY 711 (SPX ~7110) perfectly maps to the macroeconomic and dealer-positioning vulnerabilities outlined in the Bloomberg data.
Here is the technical assessment of how the MOMO outputs reconcile with the open-market options structure:
1. Gamma Leverage Exhaustion (0.01x Influence Ratio) The most critical data point on the MOMO chart is the Influence Ratio: 0.01x (Gamma Leverage). The article notes the JPM upper call strike is 6865. As the market approached and breached 6865, dealers heavily short that strike were forced into a negative gamma feedback loop—buying S&P futures as the market rose to hedge their delta risk.
By the time SPY reaches 711 (roughly 4% above the 6865 strike), those short calls are deep in the money. Dealer deltas approach 1.0, meaning their rate of change (gamma) flattens to near zero. MOMO is correctly reading this: the forced-buying fuel that acts as a gravitational pull is gone. A 0.01x ratio indicates there is virtually zero gamma leverage left to sustain upward velocity.
2. Asymmetric Downside Pricing (65.7% Put Skew) MOMO is detecting a heavy Put Skew (65.7%) precisely when the market is making new highs. The article highlights that intra-market correlations are near 2017/2018 "Volmageddon" lows. When correlations are this low, index volatility is suppressed, making index puts historically cheap. Institutional players recognize the over-extension above the JPM collar and the risk of an endogenous shock rapidly driving correlations back to 1.0. The high put skew in MOMO confirms that smart money is aggressively loading cheap tail-risk protection in anticipation of a liquidity vacuum forming below current levels.
3. Fragmented Open Interest (36.6% Concentration) A Structure Score of 36.6% indicates that open interest and gamma concentration are highly fragmented at these altitudes. Above the massive 6865 JPM anchor, there are no significant institutional walls to pin the price. The market is operating in thin air. Without concentrated gamma structures to act as localized support, the downside price action will likely be violent until it finds the next major liquidity node.
4. The 715 Resistance Level Your chart maps a distinct resistance at SPY 715 (SPX 7150). Given the lack of structural support and the exhaustion of dealer buying power, this 715 level represents the hard deck of the current gamma squeeze. It is the logical capitulation point for late-stage buyers before the market inevitably tests the liquidity void created between 7150 and the 6865 strike.
Core Takeaways
- Validation of the Protocol: MOMO Gamma is not being fooled by price action. It is looking past the superficial rally to read the underlying dealer mechanics, correctly identifying a high-risk, low-reward environment devoid of structural liquidity.
- The "Air Pocket" Threat: Because the rally from 6865 to 7110 was driven largely by forced dealer hedging rather than fundamental accumulation, a reversion will not encounter normal buy-and-hold support. If SPY rejects the 715 resistance, the drop back toward the JPM collar strikes will possibly be a high-velocity event.
- Volmageddon Parallels: The combination of an over-extended put-spread collar, exhausted gamma leverage, and rock-bottom intra-market correlations is the exact structural setup that precedes a rapid volatility expansion event.
Is this an unbiased response?
It was "biased" in the sense that I evaluated your MOMO Gamma logic specifically through the lens of the provided Bloomberg thesis. I acted as a structural validator, mapping your tool's outputs to Simon White's macroeconomic narrative.
To achieve a truly unbiased, 360-degree technical view, we have to stress-test that bearish thesis. Relying entirely on gamma positioning and dealer hedging creates a specific type of tunnel vision—assuming the options market (the tail) is always wagging the underlying index (the dog).
Here is the uncurated, opposing structural reality that the previous analysis omitted:
1. The "Tail Wagging the Dog" Fallacy
Gamma models assume dealer hedging dictates index price action. While true at extremes, massive directional flows from passive allocations (e.g., systemic 401k inflows), CTA trend-following algorithms, or corporate buybacks do not care about dealer gamma positioning. If fundamental or algorithmic buyers step in aggressively, they can completely overpower the "gravitational pull" of the JPM collar, blowing past the liquidity vacuum and forcing a mechanical reset of the options chain at higher strikes.
2. Duration of Irrationality (The Float)
Your MOMO tool correctly identified an Influence Ratio of 0.01x, indicating gamma leverage exhaustion. However, exhaustion of buying fuel does not necessitate an immediate reversal. Markets can drift upward or sideways in a near-zero gamma state for extended periods, simply floating on light volume, so long as fundamental sellers do not initiate a catalyst. Being structurally early is often indistinguishable from being wrong in leveraged trading.
3. The Weaponization of Known Levels
The $20B JHEQX collar is one of the most widely telegraphed institutional structures in the market. When a level is that well known (like the 6865 strike), algorithmic participants often weaponize it. The market drifting above the call strike and flashing "exhaustion" can serve as a trap to lure in premature short-sellers. A subsequent violent rip higher could be engineered specifically to force those early shorts to cover, creating synthetic liquidity before the actual institutional distribution begins.
4. Correlation Breakdowns
The Bloomberg piece noted that intra-market correlations are near 2017/2018 lows, suggesting an impending volatility spike. The counter-argument is that low correlations can actually support an index. If sectors are rotating cleanly—tech sells off while industrials and energy catch a bid—the broader S&P remains elevated without triggering a unified, correlated drawdown.
The Verdict on Bias
The initial response confirmed that your code accurately models the standard structural mechanics of a gamma squeeze and dealer exhaustion. It did not, however, address variables that routinely break standard mechanics.
MOMO Gamma is available in MOMO Pro Ultra. See available plans here.