
Matterhorn vs. Zacks, Investor’s Business Daily and Value Line

What Are You Paying For—and What Do the Returns Really Show?
Editorial Analysis • Research checked September 13, 2026
Disclosure: This comparison is written from the perspective of the team developing Matterhorn. It is an assessment of competing research approaches, not an independent product review. Matterhorn pricing below comes from its marketing materials; additional price details are identified explicitly.
For self-directed investors managing $500,000 or more, a research subscription is a tool for making informed decisions about substantial capital. Matterhorn brings a modern workflow to a longstanding investing question: which companies can turn growth into lasting value for shareholders? Matterhorn combines financial screening, machine-learned rankings, and LLM-assisted analysis with links to the evidence behind the investment case. Its historical research results haven proven promising, while its published research history is much shorter than those of Zacks, Investor’s Business Daily, and Value Line.
The Matterhorn workflow begins with discovering top opportunities across Its covered market, followed by investigation of the company and its peers. The comparison has two dimensions: the investment outcomes associated with a particular strategy, and the research experience a subscription provides. Matterhorn’s value proposition spans both opportunity discovery and the work of understanding a company: inspecting demand, testing the bull and bear cases, and identifying what evidence would change the thesis. The return figures below retain their exact strategy and historical scope so readers can judge them fairly.
Four approaches to finding an opportunity
Zacks emphasizes changes in analysts’ earnings estimates. Its Rank is primarily a short-horizon signal, intended for roughly one to three months. This makes it useful for investors seeking companies whose earnings expectations are improving. Its Premium service offers access to the top-ranked list and research tools at a relatively modest subscription price. Zacks Rank, Zacks’s explanation of the rating horizon.
Investor’s Business Daily (IBD) combines company growth with market behavior. Its methodology examines earnings and sales growth, institutional sponsorship, and market trend. The products serve different purposes: IBD Digital provides research and ratings; Leaderboard provides a curated model portfolio with trading plans; MarketSurge provides a more extensive charting and screening workspace. A comparison that treats all three as one subscription misses both the cost and the workflow differences. IBD’s 2026 Leaderboard guide.
Value Line organizes fundamental research into standardized company reports, ratings, and forecasts. Its Timeliness ranking addresses relative performance over six to twelve months; Safety addresses a different question about risk. Its longer-term projections serve yet another horizon. For investors who want a consistent framework for comparing established businesses, this separation is useful. Ranking methodology, Value Line product guide.
Matterhorn connects demand, business economics, and shareholder outcomes. Revenue growth alone is insufficient: margins, free cash flow, dilution, valuation, and the credibility of forward demand all matter. A backlog figure, remaining performance obligation, customer-retention metric, and management forecast describe different things; preserving their source and scope is central to the approach. The financial screen, machine learning research ranking, and AI LLM analyst each contribute a distinct part of the workflow.
What ML and an AI research analyst add
Matterhorn combines three modern and complementary technologies:
| Layer | What it does | Why it matters to the researcher |
|---|---|---|
| Financial and evidence analysis | Calculates comparable growth, margins, cash economics, dilution, and other measures; retains source references and missing-data status | Lets the investor inspect the facts behind a ranking |
| Machine learning across multiple dimensions | Uses LightGBM ranking models to learn nonlinear relationships among financial, demand, valuation, and market inputs; a separate classifier addresses persistence of favorable economics | Can examine combinations and thresholds that a fixed checklist alone would miss |
| LLM-assisted research | Supports Ask and structured bull, bear, research-manager, and validator roles over the company’s evidence | Helps turn a collection of metrics into competing explanations, research priorities, and conditions to monitor |
In the reviewed 30/70 research release, ML contributes 30% of the ranking and explicit economic/evidence components contribute 70%. The LLM commentary is a separate analytical layer: its prose does not change those scores or become a new financial fact. Source references and verification statuses help readers distinguish the recorded evidence from the model’s interpretation. These are several review roles within the workflow, not four independent human experts.
Consider a company reporting faster backlog growth. The research question is whether that backlog can convert into profitable revenue without excessive investment or shareholder dilution. Matterhorn’s workflow brings the demand disclosure, financial measures, supporting argument, counterargument, and follow-up conditions into the same investigation. That connected research process is a substantial part of the product’s value proposition, separate from any one ranking statistic.
Matterhorn combines modern ML with LLM-assisted research. The established providers are also evolving: Zacks announced an Equity Research AI Agent for Microsoft 365 Copilot in November 2025, IBD offers algorithmic pattern recognition, and Value Line combines several inputs in its ranking system. Matterhorn’s distinction lies in how it connects these capabilities to source evidence and the economics of potential compounders. Based on the marketing materials, Zacks’s professional AI offering should not be assumed to be included in the retail subscriptions below. Zacks AI announcement, MarketSurge capabilities, Value Line methodology.
What the subscriptions cost
Prices are in U.S. dollars, before any applicable taxes. Annualized monthly billing means twelve monthly payments; it does not imply an annual subscription offer. Promotions and payment discounts are excluded from the main comparison.
| Product | Price found | What the buyer principally gets |
|---|---|---|
| Matterhorn Investment Research | $349/quarter or $999/year | Evidence-linked company research and quantative rankings; using deep ML modeling. Results shown below. |
| Zacks Premium | $249/year after the advertised 30-day trial | Rank access and stock research tools |
| Zacks Investor Collection | $495/year or $59/month; $708 for twelve monthly payments | A bundle of longer-term investment services plus Premium research |
| Zacks Ultimate | $2,995/year or $299/month; $3,588 for twelve monthly payments | Broad access to portfolio recommendation services across investment and trading approaches |
| IBD Digital | $38.95/month after the introductory offer; $467.40 for twelve regular monthly payments | Stock lists, ratings, Stock Checkup, and market analysis |
| IBD Leaderboard | $699/year or $69/month advertised; $828 for twelve monthly payments | Curated stock ideas, model portfolio, entry/exit plans, and alerts |
| IBD MarketSurge | $1,499/year or $149.95/month; $1,799.40 for twelve monthly payments | Advanced charting, screening, pattern recognition, and research tools |
| Value Line Smart Investor | $598 displayed; the accessible product page does not identify the billing term, so an annual equivalent remains unverified | Broad fundamental research, screening, alerts, and model portfolios |
Sources: Matterhorn marketing draft, Zacks Premium offer, Zacks subscription tiers, IBD Digital, Leaderboard, MarketSurge, Value Line Smart Investor.
Two qualifications should travel with this table. Matterhorn’s live checkout prices have not been verified. Leaderboard’s accessible sales page displays the prices above but retains a 2021 offer-expiration footer, so those figures are advertised prices requiring checkout confirmation. Value Line also distinguishes retail and professional subscriptions; its retail price should not be assumed to cover institutional use.
For a fair comparison, retain Zacks Premium as the entry-level reference and add the higher tiers. Investor Collection is the more relevant Zacks comparison for longer-term investors; Ultimate is the comparison for breadth of services. Ultimate spans additional trading approaches, so its higher price does not make it an exact substitute for Matterhorn. Zacks service descriptions.
On the $999 assumption, Matterhorn costs $504 more annually than Investor Collection, $1,996 less than Ultimate, and $500 less than MarketSurge’s annual plan. This places Matterhorn between lower-cost research subscriptions and comprehensive premium bundles, with the combined evidence, ML, and LLM workflow central to its positioning.
Returns: compare the evidence before comparing the percentages
Zacks has a substantial published hypothetical history
Zacks reports 23.80% annualized for its #1 Rank strategy from January 1, 1988 through August 3, 2026. Its contemporaneous rank tables report 11.53% for the S&P 500. These are vendor-reported results, not returns earned by a typical Premium subscriber. Published Rank history, contemporaneous return table.
The detailed disclosure describes an equally weighted hypothetical portfolio, rebalanced monthly through 2013 and weekly thereafter. It excludes trading commissions, bid–ask spreads, and market impact; some stocks with missing endpoint prices are omitted. Zacks also identifies independent accounting-firm examinations covering periods through July 1, 2024. Those examinations concern conformity with Zacks’s stated criteria, not a guarantee that investors earned the published return or that the entire record through 2026 received the same examination. Performance disclosure, expanded calculation description.
This is a stronger historical track record than Matterhorn’s current development studies. But it still requires realistic execution and cost assumptions before it becomes an estimate of a subscriber’s achievable return. Further Matterhorn will go further into sharing its return methods and procedures than any of the competitors.
The #1 Rank return is specific to that strategy. It is not an aggregate return for Investor Collection or Ultimate: subscribers can select among services with different holdings and trading rules. A higher subscription tier buys broader access, rather than assigning the bundle the best return advertised by any one constituent service.
IBD’s actual fund evidence is instructive—but product-specific
An actual investment vehicle provides a useful cross-check on IBD’s stock-selection approach: the CapForce IBD 50 ETF (FFTY). Its issuer reports the following total returns through August 31, 2026:
| Measure | FFTY at NAV | S&P 500 Total Return Index |
|---|---|---|
| One year | 5.30% | 20.38% |
| Three years, annualized | 16.03% | 21.04% |
| Five years, annualized | −4.69% | 12.79% |
These fund returns reflect fund expenses. They do not include an individual investor’s brokerage costs or taxes. The issuer reports an adopted predecessor history following the 2026 reorganization. The five-year comparison falls after the fund began tracking the IBD 50 Index in November 2017. Current fund performance, fund history and methodology.
FFTY is not Leaderboard, MarketSurge, or a record of IBD subscribers’ accounts. Leaderboard includes its own selection and trading decisions. The result shows that this investable implementation of IBD 50 materially lagged the S&P 500 over these periods. It does not establish that every IBD product or user did so.
I did not obtain a complete current Leaderboard performance schedule with sufficient methodology to assign it a comparable return. Testimonials and selected winning trades cannot fill that gap.
Value Line has an established method, but a current comparable return remains unverified
Value Line’s ranking system dates to 1965. That gives it a much longer operating history than Matterhorn. However, its Timeliness ranks, analyst model portfolios, and licensed investment funds are different strategies. Its own explanation also distinguishes geometric from arithmetic index calculations, which can produce substantially different results. Value Line methodology.
I could verify the framework, but did not obtain a recent, complete, sufficiently specified Timeliness or Smart Investor portfolio return series for this comparison. Consequently, I would not print a single “Value Line return” or infer poor performance from the absence of that series. Its research format is easier to evaluate than its incremental return to a subscriber.
Matterhorn: top opportunities against two market benchmarks
The customer starts with the strongest opportunities across Matterhorn’s covered stock universe, then investigates the business and its peers. Industry and size comparisons help explain a company; they do not define the customer’s opportunity set. The investment question is whether following the suggested opportunities produces a better result than buying the market.
Two S&P 500 funds provide useful reference points. SPY uses market-cap weighting, giving larger companies more influence. RSP, the Invesco S&P 500 Equal Weight ETF, gives the index’s companies approximately equal weights at quarterly rebalancing. Comparing with both helps distinguish performance against the familiar index from performance against a less mega-cap-dominated alternative. Both are large-cap benchmarks, while Matterhorn’s covered universe can include smaller companies. SPY methodology, RSP methodology.
The existing frozen 30% ML / 70% economic-and-evidence-component simulation supplies a concrete test. Make three equal contributions on April 1, 2015, April 1, 2016, and April 3, 2017. Split each Matterhorn contribution equally across the preceding March 31 ranking’s top 10, retaining earlier purchases. Buy each benchmark with the same contribution amounts on the same dates. This is an annual-addition-and-hold strategy: the account accumulates holdings rather than being rebalanced back to ten names.
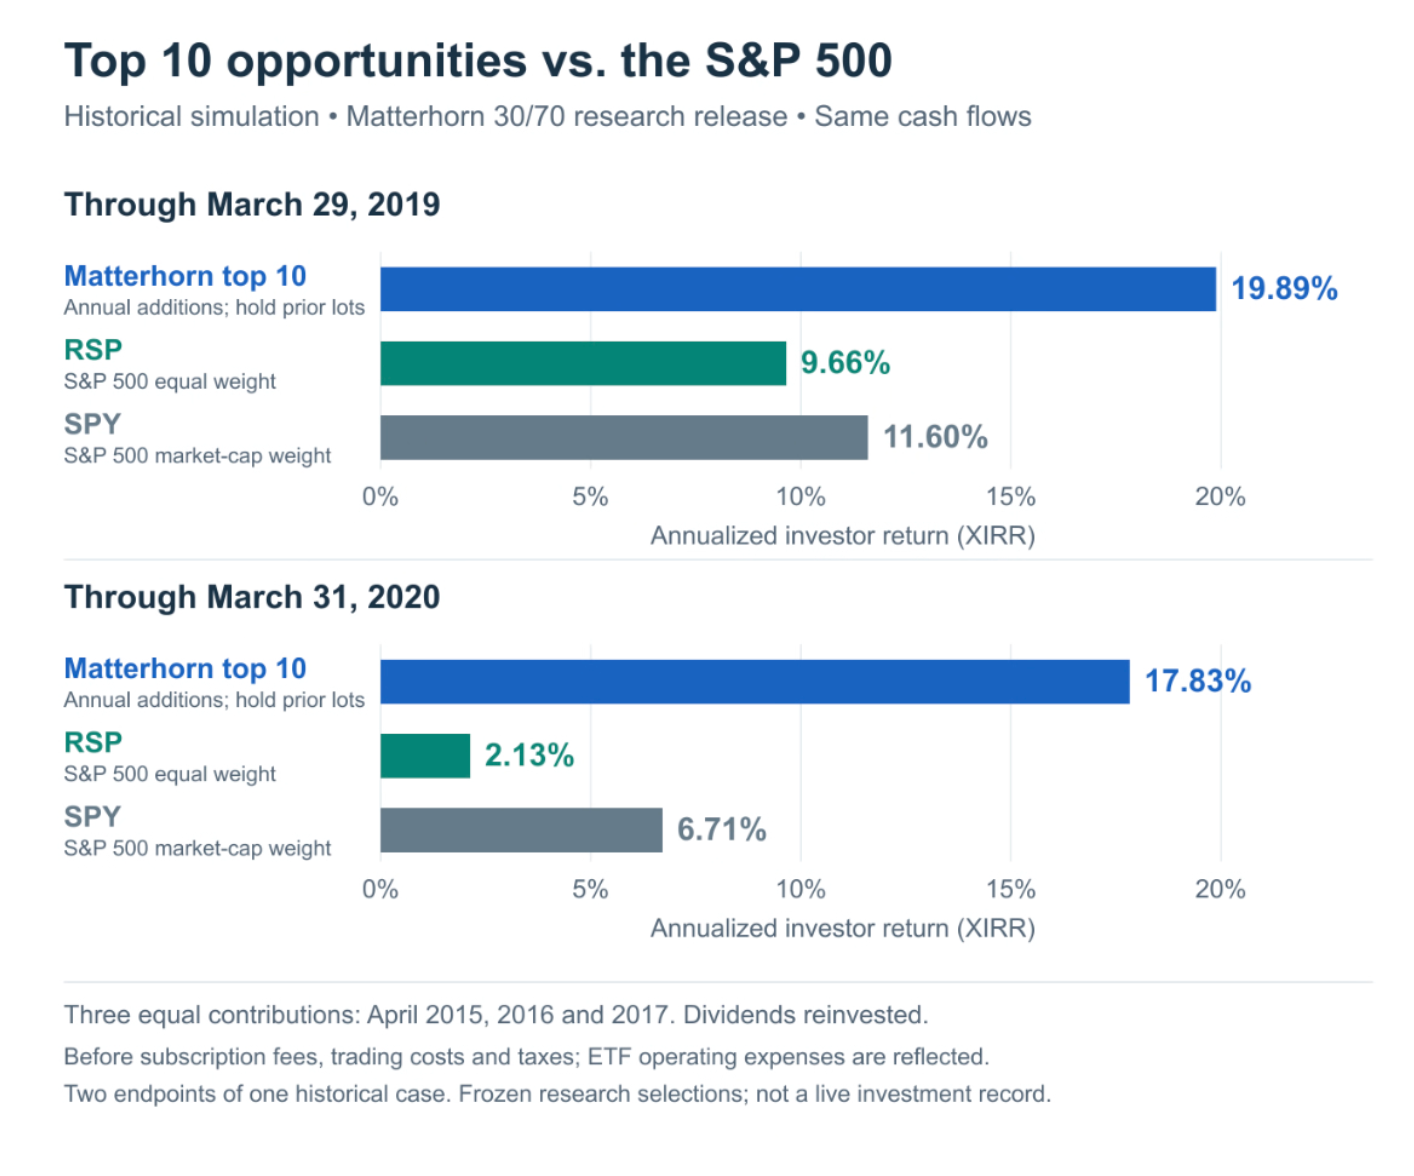
Through March 31, 2020, the historical Matterhorn selections returned 17.83% annualized, compared with 2.13% for RSP and 6.71% for SPY under the matched cash-flow rules. That is an annualized investor-return advantage of approximately 15.70 percentage points over RSP and 11.12 points over SPY. Matterhorn was also ahead at the March 2019 endpoint shown above. These are two valuations of the same historical case, not two independent trials. Original portfolio simulation, three-way calculation and methodology, precise comparison results.
The measure is XIRR, an annualized investor return that accounts for each contribution’s date. It is not the return in calendar 2019 or 2020. The comparison reinvests dividends and assumes fractional holdings; results are before subscription fees, trading costs, and taxes. ETF operating expenses are already reflected in the funds’ prices. RSP’s earlier history includes its predecessor fund. RSP fund history.
This result is encouraging evidence about the opportunities surfaced by the frozen research ranking. A concentrated collection of suggested stocks and diversified index funds still have different risks. The original replay retains an already-acquired company’s stale allocation as cash, and some interim corporate-action valuations remain incomplete, so it does not establish a complete daily return path or maximum drawdown. The comparison uses the original portfolio endpoints; execution capacity at larger portfolio sizes was not tested. Portfolio assumptions and limitations.
A separate, broader development analysis supplies additional context. Across 48 overlapping historical starting months, the measured top-100 30/70 baskets averaged 16.56% annualized over two years, versus 12.89% for same-window SPY, with outcomes available for an average 67.1 of 100 selections. That is a different construction from the top-10 portfolio above. The March 2018 basket lost 6.74% annualized, versus SPY’s +0.96%; a later challenger’s small improvement had an exploratory interval that included zero, and simpler ranking baselines also performed better on the reported ranking metric. Development results and baseline comparisons, historical windows and coverage.
Matterhorn’s published research history is shorter than that of the established providers. Its combination of market-wide opportunity discovery within its covered universe, evidence-linked company analysis, and an LLM research partner is the product proposition. The clearest performance evidence follows those suggested opportunities into a portfolio and compares the outcome with investable market alternatives. The next extension is the same fixed policy across more starting dates and a prospective record, with risk and costs alongside returns.
Where Matterhorn is better positioned—and where it is weaker
These are assessments of product fit, not experimentally proven rankings of usability or investment performance.
| Investor’s Need | Traditional Option | Matterhorn’s Research Positioning |
|---|---|---|
| Access to earnings-revision ideas | Zacks Premium | Integratates earnings revisions and shows as algorithmic scoring changes |
| Bundled longer-term stock ideas | Zacks Investor Collection | Matterhorn takes 2 prong approach -top scored companies weighted by the themes investor is most interested |
| Broad access to investment and trading services | Zacks Ultimate | Matterhorn has a narrower focus and a lower draft annual price |
| Defined trading plans and buy/sell alerts | IBD Leaderboard | Matterhorn emphasizes research priorities and thesis monitoring |
| Extensive technical charting | IBD MarketSurge | Matterhorn’s emphasis is company evidence and research prioritization |
| Standardized fundamental reports and long-horizon forecasts | Value Line | A mature alternative to Matterhorn’s evolving research workflow |
| Inspecting forward-demand claims, dilution, cash economics, and missing evidence | Matterhorn’s evidence workflow | Connects source material, financial analysis, and explanations in one investigation |
| Exploring a thesis through questions and competing interpretations | Matterhorn’s LLM-assisted workflow | Ask plus bull/bear/manager/validator roles; interpretation remains distinguishable from recorded facts |
| Evaluating historical investment outcomes | Examine each named strategy and its record | Matterhorn offers promising retrospective results with a shorter published history |
Matterhorn’s strongest positioning is to help investors understand why a company might compound and what would disprove that thesis. The product combines opportunity discovery with the evidence and competing interpretations needed to investigate the opportunity.
Does the subscription earn its cost?
Matterhorn is intended for investors with portfolios of $500,000 and larger. At the draft $999 annual subscription price, the cost relative to capital is:
| Portfolio value | Annual Matterhorn fee | Fee as a share of the portfolio |
|---|---|---|
| $500,000 | $999 | 0.20% — about 20 basis points |
| $1 million | $999 | 0.10% — about 10 basis points |
| $2 million | $999 | 0.05% — about 5 basis points |
For a $500,000 portfolio, Matterhorn’s additional annual cost over Zacks Premium is $750, or 0.15% of capital. Compared with the longer-term Investor Collection bundle, the difference is $504, or about 0.10%. Matterhorn’s annual price is $1,996 below Ultimate’s. These are simple subscription-cost ratios, before differences in trading costs and taxes.
At this portfolio scale, the decision is about the quality and usefulness of the research. Does the service surface opportunities worth investigating, expose weaknesses in an investment thesis, and make ongoing company research more productive? Matterhorn’s combination of source evidence, an ML-assisted shortlist, and an LLM research partner addresses that broader job. Returns remain central; the investor also gets a framework for understanding what they own and what would change the investment case.
What would make a stronger comparison possible?
The next credible step is a fixed, prospective comparison: timestamp the actual recommendations, define executable entry and exit rules, retain all selections, and report outcomes against same-date benchmarks. Each service needs its own faithful strategy rules; a separate standardized stock-selection test can help distinguish selection skill from trading and allocation choices.
For Matterhorn, the notion of getting in at the earliest inflection trigger is attractive as not only are you maximizing compounding, but your are minimizing drawdown. Of course this is only true, if the timing of your investment is right and no macro changes derail your efforts.
Zacks spans inexpensive ranking access through comprehensive premium bundles. IBD offers an explicit trading workflow, while its IBD 50 fund illustrates that a respected selection method can still endure long underperformance. Value Line offers a mature fundamental research framework. Matterhorn combines those enduring questions about business quality with machine-learned ranking and LLM-assisted investigation. Its appeal is a modern, connected way to research potential compounders, supported by promising historical studies and a growing research record.
*Historical results are not forecasts. This article compares research services and evidence; it does not recommend particular securities.
Learn more about Matterhorn Inflection Research