
Beyond NVIDIA: Putting Matterhorn’s Top-Ranked Stocks to the Test

In our proof positive analysis we highlighted the earliest signals we found for 50 stocks which had strong compounding to indicate the strength of Matterhorn's quantitative analysis capabilities. As with everything, it was fully a blind analysis whereby I gave 50 known compounders and told Matterhorn to rewind to the earliest time frame which the top stocks would have triggered a notification in Matterhorn. The results can be seen in the Basecamp to Matterhorn page and are quite impressive.
Selecting the Top 25 at the same moment NVIDIA ranked #6 is meaningful because it tests the model’s judgment across an entire group—not just a famous winner chosen in hindsight. It asks what someone following those rankings would have owned, including the disappointments, and whether that group outperformed SPY. That reveals whether NVIDIA belonged to a broadly useful set of signals or carried an otherwise weak portfolio.
It is our way of providing full transparency of the model. Nothing was calculated, previously measured or pre-optimized to make Matterhorn look good.
Basecamp’s historical reconstruction places NVIDIA sixth in Matterhorn’s ML blended research ranking on March 31, 2015. A successful example invites a harder question: did the rest of the group selected at that same moment produce useful returns, or does the story depend on one exceptional winner?
This study answers that question with fixed historical baskets. We reconstructed the archived ranking, retained the first 5, 10 and 25 companies, and measured what happened after one equal-dollar purchase. There was no ongoing rotation into new top-ranked names. This is a moment-in-time portfolio experiment, not a proposed trading strategy.
From the Basecamp observation to a portfolio test
We did not roll back the live application or alter today’s scores. We recovered archived inputs and fold-model predictions. Applying today’s model backward could introduce knowledge learned after the observation date; the archived emergence fold instead used 4,696 training rows, with its latest training outcomes known by January 31, 2015 and the existing 31-day purge.
The reconstruction also exposed an important version distinction. Public Basecamp uses an original-model blend with corrected ADR inputs and a 1,998-company March pool. This portfolio study uses the retained earnings-enhanced historical blend and 1,969 eligible companies. Both place NVIDIA sixth. That agreement reconciles the NVIDIA example, but it does not make the two datasets interchangeable. The returns below belong to the earnings-enhanced recipe; they are not an exact portfolio replay of the original Basecamp pool or the current deployed model.
The recipe combines 70% component score with 30% emergence-model percentile. The component score itself includes a previously frozen learned durability estimate. Calling it “70% deterministic and 30% AI” would therefore misdescribe this research configuration.
How the investment comparison works
The ranking date is March 31, 2015. Each portfolio buys at the next trading-session close, April 1, allocating equal initial dollars per company, and holds unchanged through March 31, 2017 or March 31, 2020. SPY, the S&P 500 ETF, uses identical entry and end dates. Qualified price paths account for splits and reinvested dividends, with documented acquisition treatment where supported. There are no replacement stocks or rebalancing. Figures are before fees and taxes; scaling to $1 million assumes the same prices and does not simulate liquidity, market impact or execution costs.
The Top 5, Top 10 and Top 25 were specified before this run’s outcome evaluation. The Top 10 is the complete-return illustration because all ten holdings have usable outcomes at both horizons. It is not the only basket we tested, and we retain the other results below. The dates and development history were already familiar: this was not a blind test registered in 2015.
$100,000 and $1 million portfolios versus SPY
The Top-10 portfolio returned 55.46% over two years and 205.72% over five years. SPY returned 19.50% and 38.55% over the same periods. Annualized, those figures are 24.70% and 25.05% for the Top 10, versus 9.32% and 6.74% for SPY.
Measured endpoints, not a continuous growth curve. Both charts use the same underlying returns.
| Starting capital | Holding period | Top-10 ending value | SPY ending value | Dollar advantage |
|---|---|---|---|---|
| $100,000 | 2 years | $155,458 | $119,497 | $35,961 |
| $100,000 | 5 years | $305,724 | $138,550 | $167,174 |
| $1,000,000 | 2 years | $1,554,583 | $1,194,972 | $359,611 |
| $1,000,000 | 5 years | $3,057,236 | $1,385,501 | $1,671,735 |
The complete ranked list, including delisted or acquired results
These are the original 25 selections. Company names reflect retained filing metadata available by the observation date. Symbols are archive locators, so later labels KDP, ZD and BBWI correspond here to Dr Pepper Snapple, J2 Global and L Brands. “Unknown” means the research could not admit a continuous, qualified return path; it does not mean the stock returned zero.
| Rank | Filed company name | Symbol locator | Score / 100 | Emergence-only rank | 2-year total return | 5-year total return |
|---|---|---|---|---|---|---|
| 1 | APPLE INC | AAPL | 72.91 | 139 | 20.28% | 122.43% |
| 2 | HENRY JACK & ASSOCIATES INC | JKHY | 72.76 | 58 | 37.43% | 137.10% |
| 3 | ENPHASE ENERGY, INC. | ENPH | 71.56 | 20 | -89.52% | 147.05% |
| 4 | DR PEPPER SNAPPLE GROUP, INC. | KDP | 71.33 | 76 | 30.80% | 94.86% |
| 5 | BRIGHT HORIZONS FAMILY SOLUTIONS INC. | BFAM | 71.24 | 13 | 39.27% | 95.97% |
| 6 | NVIDIA CORP | NVDA | 70.59 | 107 | 430.07% | 1,197.03% |
| 7 | KULICKE & SOFFA INDUSTRIES INC | KLIC | 70.09 | 137 | 29.67% | 38.89% |
| 8 | FACTSET RESEARCH SYSTEMS INC | FDS | 70.06 | 62 | 5.37% | 72.43% |
| 9 | QIAGEN NV | QGEN | 70.01 | 72 | 15.86% | 66.39% |
| 10 | HOME DEPOT INC | HD | 70.01 | 90 | 35.36% | 85.08% |
| 11 | J2 GLOBAL, INC. | ZD | 69.33 | 147 | 31.01% | 22.48% |
| 12 | ESTEE LAUDER COMPANIES INC | EL | 69.06 | 189 | Unknown | Unknown |
| 13 | TEXAS INSTRUMENTS INC | TXN | 69.01 | 74 | Unknown | Unknown |
| 14 | O REILLY AUTOMOTIVE INC | ORLY | 69.01 | 298 | 25.37% | 39.86% |
| 15 | LUMINEX CORP | — | 68.96 | 148 | Unknown | Unknown |
| 16 | HEADWATERS INC | HW | 68.93 | 73 | 29.80% | Unknown |
| 17 | JAZZ PHARMACEUTICALS PLC | JAZZ | 68.86 | 79 | -15.14% | -41.68% |
| 18 | ANSYS INC | ANSS | 68.72 | 375 | 21.26% | 163.78% |
| 19 | SEI INVESTMENTS CO | SEIC | 68.59 | 256 | 16.69% | Unknown |
| 20 | CADENCE DESIGN SYSTEMS INC | CDNS | 68.39 | 50 | 70.74% | 259.11% |
| 21 | L BRANDS, INC. | BBWI | 68.38 | 129 | -44.99% | -83.83% |
| 22 | INTERCONTINENTAL EXCHANGE, INC. | ICE | 67.97 | 172 | 32.99% | 86.43% |
| 23 | ESSEX PORTFOLIO LP | ESS | 67.87 | 157 | 7.68% | 11.70% |
| 24 | HAEMONETICS CORP | HAE | 67.83 | 83 | -8.75% | Unknown |
| 25 | EMPIRE STATE REALTY TRUST, INC. | ESRT | 67.81 | 156 | 15.56% | -45.70% |
At two years, 22 of 25 outcomes are available; at five years, 19 of 25. Estée Lauder and Texas Instruments fail the retained continuity checks; Luminex lacks an admitted path. At five years, SEI Investments and Haemonetics also fail continuity checks, and Headwaters lacks the required terminal endpoint. Those gaps prevent a complete Top-25 portfolio headline. The known subsets returned 33.49% and 129.97%, respectively; these are not returns of the full 25-stock portfolio.
How much did NVIDIA matter?
No denying NVIDIA mattered substantially. It returned significantly over two years and over 1000% over five years in the admitted executable paths. With a 10% initial allocation, it contributed approximately 43.01 and 119.70 percentage points to the Top-10 portfolio’s total returns of 55.46% and 205.72%. That said, we are obviously proud that Nvidia was chosen by Matterhorn's logic.
As a post-result attribution diagnostic, equally weighting the other nine names would have returned 13.84% over two years and 95.58% over five years. That nine-name calculation is not another preselected strategy. It shows that NVIDIA led the two-year outperformance, while the remaining group also exceeded SPY over five years. Seven of ten holdings beat SPY over two years; all ten beat it over five years.
The exact non-ML comparison: original Basecamp
The recovered original Basecamp pool lets us compare its rules-only screen and its original blend on the same 1,998 companies. The rules-only ranking contains no learned emergence or durability output. It is the archived deterministic financial screen, not today’s full production scoring system. This is a separate, matched-pool comparison from the earnings-enhanced 1,969-company study above.
The non-ML version produced positive results. Its Top 10 returned 24.17% over two years, or 11.44% annualized, ahead of SPY’s 19.50% total and 9.32% annualized. The original Basecamp blend returned 51.74% total and 23.20% annualized. All ten holdings have measured two-year outcomes for each method.
| Horizon | Method | Known holdings | Total return | CAGR | $100,000 becomes | $1,000,000 becomes | Maximum drawdown |
|---|---|---|---|---|---|---|---|
| 2 years | Basecamp rules-only | 10/10 | 24.17% | 11.44% | $124,173 | $1,241,734 | -28.62% |
| 2 years | Basecamp ML blend | 10/10 | 51.74% | 23.20% | $151,736 | $1,517,363 | -15.51% |
| 2 years | SPY | Complete | 19.50% | 9.32% | $119,497 | $1,194,972 | -13.01% |
| 5 years | Basecamp rules-only | 9/10 | Unknown | Unknown | Unknown | Unknown | Unknown |
| 5 years | Basecamp ML blend | 10/10 | 191.04% | 23.82% | $291,040 | $2,910,400 | -36.68% |
| 5 years | SPY | Complete | 38.55% | 6.74% | $138,550 | $1,385,501 | -33.70% |
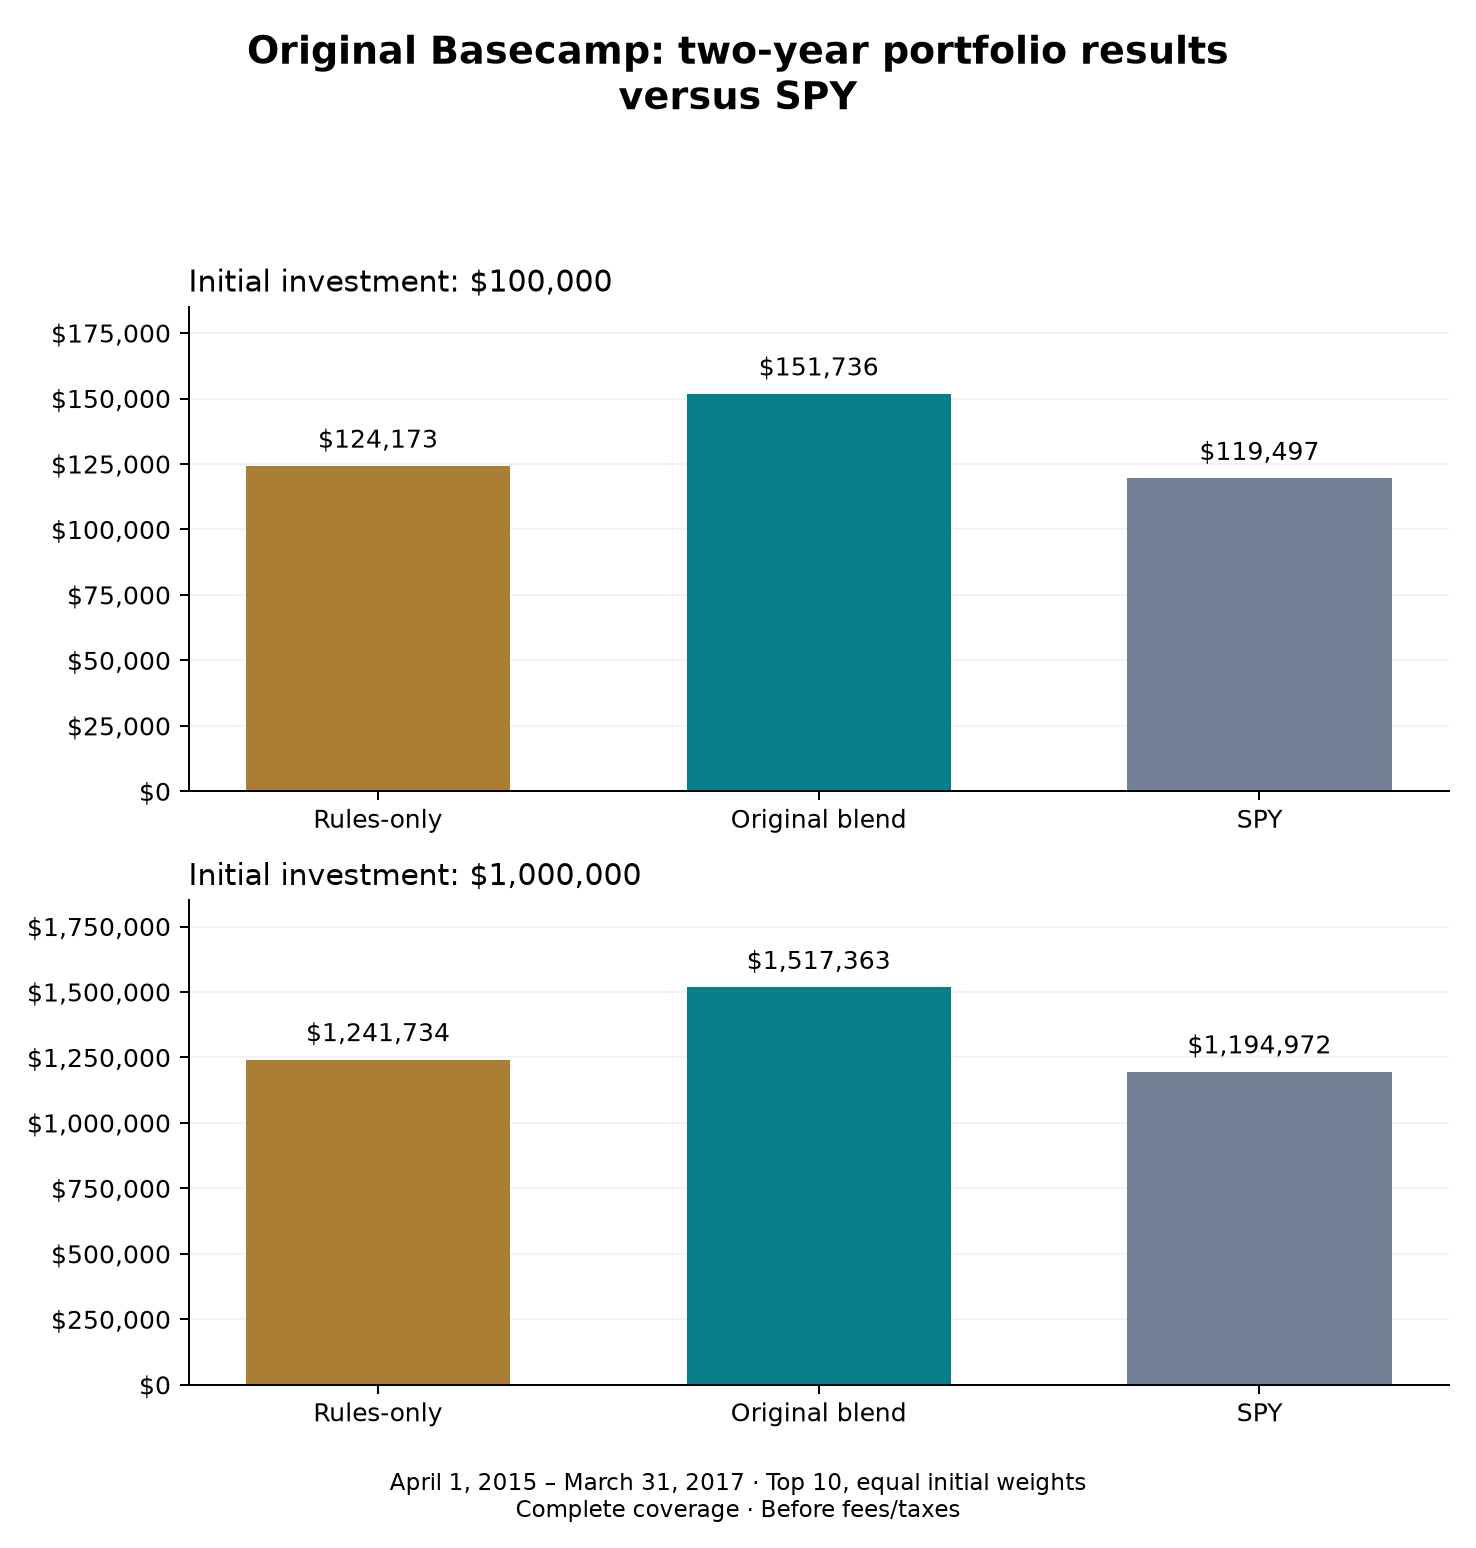
At five years, nine rules-only holdings are measured; Web.com’s private buyout result nullified it. The full Top-10 return is therefore unknown. Retaining each known holding’s original 10% weight, their combined ending value alone is $163,818 per $100,000 invested, versus $138,550 for SPY. This is a lower bound assuming the unresolved long-only holding cannot have negative terminal value, not an observed complete-portfolio result. We do not estimate Web.com’s proceeds or reweight the other nine as though it never existed. (Note: It was acquired at roughly the same price it printed in 2015 selection)
The rules-only Top 5 is complete at both horizons: 16.94% annualized over two years and 11.40% over five. It beat the original blended Top 5 over two years (3.76%), while the blend led over five (17.03%). The rules-only Top-10 two-year maximum drawdown was 28.62%, versus 15.51% for the original blend and 13.01% for SPY. Stronger returns and a smoother holding experience are separate questions.
Matterhorn Top 25 Findings
| Rank | Filed name | Symbol locator | CIK | Score /100 | 2-year total return | 5-year total return |
|---|---|---|---|---|---|---|
| 1 | J2 GLOBAL, INC. | ZD | 0001084048 | 89.34 | 31.01% | 22.48% |
| 2 | BIOGEN IDEC INC. | BIIB | 0000875045 | 88.81 | -33.93% | -23.54% |
| 3 | ILLUMINA INC | ILMN | 0001110803 | 87.63 | -6.35% | 49.89% |
| 4 | ALIGN TECHNOLOGY INC | ALGN | 0001097149 | 85.16 | 118.70% | 231.65% |
| 5 | COGNEX CORP | CGNX | 0000851205 | 84.97 | 74.15% | 77.22% |
| 6 | F5 NETWORKS INC | FFIV | 0001048695 | 84.47 | 24.72% | -6.72% |
| 7 | COMMVAULT SYSTEMS INC | CVLT | 0001169561 | 84.19 | 16.86% | -6.88% |
| 8 | COSTAR GROUP INC | CSGP | 0001057352 | 83.48 | 4.81% | 197.02% |
| 9 | FORTINET INC | FTNT | 0001262039 | 81.09 | 12.63% | 197.06% |
| 10 | WEB.COM GROUP, INC. | WEB | 0001095291 | 80.30 | -0.87% | Unknown |
| 11 | EBAY INC | EBAY | 0001065088 | 80.03 | 39.64% | 27.52% |
| 12 | IPG PHOTONICS CORP | IPGP | 0001111928 | 78.94 | 31.28% | Unknown |
| 13 | LULULEMON ATHLETICA INC. | LULU | 0001397187 | 78.00 | -17.80% | 200.40% |
| 14 | OPEN TEXT CORP | OTEX | 0001002638 | 77.99 | 30.22% | 40.51% |
| 15 | ANSYS INC | ANSS | 0001013462 | 77.66 | 21.26% | 163.78% |
| 16 | PRA GROUP INC | PRAA | 0001185348 | 77.36 | -39.87% | -49.72% |
| 17 | AVAGO TECHNOLOGIES LTD | — | 0001441634 | 76.53 | Unknown | Unknown |
| 18 | SYNTEL INC | SYNT | 0001040426 | 76.23 | -47.98% | Unknown |
| 19 | ALEXION PHARMACEUTICALS INC | ALXN | 0000899866 | 76.21 | -28.47% | -47.03% |
| 20 | MIDDLEBY CORP | MIDD | 0000769520 | 76.18 | 30.24% | -45.70% |
| 21 | SALESFORCE COM INC | CRM | 0001108524 | 75.97 | 24.83% | 117.89% |
| 22 | ULTIMATE SOFTWARE GROUP INC | — | 0001016125 | 75.69 | Unknown | Unknown |
| 23 | GILEAD SCIENCES INC | GILD | 0000882095 | 75.55 | -27.50% | -11.80% |
| 24 | SENIOR HOUSING PROPERTIES TRUST | DHC | 0001075415 | 75.55 | Unknown | Unknown |
| 25 | PRICELINE GROUP INC. | BKNG | 0001075531 | 75.36 | 54.85% | 17.03% |
These holdings belong to the archived rules-only portfolio. Missing returns remain unknown; the same identity, corporate-action and source-continuity rules apply to every method. The original Basecamp blended Top 10 was KDP, AAPL, JKHY, ENPH, BFAM, NVDA, ZD, KLIC, QGEN and GILD. Its five-year ending value was $291,040 per $100,000, rather than the later earnings-enhanced blend’s $305,724 shown above.
Other retained controls
The research also retained broad-screen, component-only, emergence-only and simple feature controls for the later earnings-context study. Component-only includes learned durability and is not a non-ML baseline. The broad-screen proxy’s two-year Top-10 result happens to match the exact archived rules-only portfolio here; that does not make the full universes or recipes interchangeable.
| Top-10 selection method | 2-year annualized | Coverage | 5-year annualized | Coverage |
|---|---|---|---|---|
| Historical 70/30 blend | 24.70% | 10/10 | 25.05% | 10/10 |
| Broad-screen proxy | 11.44% | 10/10 | 12.73% subset | 9/10 |
| Component-only (includes learned durability) | 3.86% subset | 9/10 | 3.95% subset | 8/10 |
| Emergence ML only | 12.04% subset | 9/10 | -15.26% subset | 9/10 |
| Momentum control | -13.38% | 10/10 | -2.25% | 10/10 |
| Growth control | -5.76% subset | 5/10 | -18.66% subset | 5/10 |
| Quality control | -5.27% subset | 5/10 | -0.72% subset | 5/10 |
| SPY | 9.32% | Complete | 6.74% | Complet |
The broad-screen proxy beat SPY over two years with complete coverage: 11.44% annualized versus 9.32%. Its five-year figure is based on nine measured holdings, so it cannot be presented as a complete portfolio comparison. Component-only and emergence-only measured results were weaker than the blend, particularly over five years. 100% incomplete coverage slightly skews treating the data, but its a statistically signifcant test of ML’s contribution.
The losses and the holding experience
The blended Top 5 returned just 7.65% over two years, below SPY’s 19.50%, before reaching 119.48% over five years. Enphase fell 89.52% across the two-year holding window, yet finished the five-year window up 147.05%. NVIDIA sat at rank six, outside that narrower basket. The emergence-only Top 5 gained 62.07% over two years but lost 51.17% over five. Neither basket size nor holding period is a cosmetic choice.
The blended Top 10’s maximum measured drawdown was 14.99% on the two-year path and 35.98% on the five-year path. The longer period includes the March 2020 market decline. For each portfolio, drawdown measures the fall from its prior peak—not a guaranteed dollar loss from the initial contribution. These outcomes required enduring meaningful declines; a strong ending balance does not describe a smooth path.
Interpreting the results
We reproduced the archived emergence predictions exactly for the 48-name union of the blend and emergence Top-25 lists. Fifteen focused checks passed, covering return arithmetic, source and endpoint refusals, frozen ranks, missing-outcome handling, identical SPY dates, training maturity and model explanations. This establishes reproducibility and bounded calculation integrity.
NVIDIA’s explanation included positive contributions from operating leverage, demand-evidence count, revenue growth, annual acceleration and reduced share count, with negatives from three-year growth, recent quarterly acceleration and missing FCF margin. These are model-score contributions, not causal explanations for the later stock return. NVIDIA ranked 107th on emergence alone and 41st on components alone; the combined ranking placed it sixth.
The portfolio evidence is significant for this historical view at this specific date. Matterhorn’s ML-enhanced Top 10 turned $100,000 into $155,458 in two years—a 55.46% total gain and 24.70% CAGR. Over five years, that portfolio grew to $305,724, delivering a 205.72% total gain and 25.05% CAGR. SPY grew the same investment to $119,497 and $138,550, respectively. A $1 million starting portfolio would have reached $1.55 million after two years and $3.06 million after five. These historical results reflect equal initial investments held without rebalancing, before fees and taxes.
Get started with Matterhorn Research today.