
Strategy for Consistently Banging out 1 min Scalps.

Ever since we've released our MOMO Chat we've come to see momentum trading a bit differently as we speak with others in our budding community. Where we have had more of a traditional view - the day traders among us, use MOMO Pro to find momentum over a much shorter timeframe - as in minutes or less.
And we've witnessed impressive returns by those who are experts in this micro-momentum craft. Not occasional 4 figure returns, but daily 4 figure returns and frequent 5 figure returns - with a very high .700+ batting average. How? Well having witnessed it for several months on Chat it's come down to following a very disciplined approach in a way that leaves little in the way of guesswork.
So having taken notice, I spent the past few weeks taking notes to capture this approach the best I could and also had one of the best scalpers review it for accuracy.
Steps to Success
1) Use one of the premier brokerage platforms.
DAS trader and Interactive Brokers (IB) are frequently suggested. The more popular retail platforms are less than inspired to get you fastest NBBO and when you are trading for seconds or fractions of seconds that can be the difference of .20 or so of "pricing knowledge". Scwhab, Etrade, Robinhood and the like are not modernizing their platforms, nor providing the best fills and as such you are left at a disadvantage. And while you may shake your head at this - If DAS or IB are showing a bid $.10 higher 500ms faster that is a huge edge and something you can capitalize upon.
2) Scan in premarket for action.
The most consistent scalpers are those working in pre-market. Using screens to find gaps, unusual volume, and related news. Must the trading be in pre-market? Not necessarily, but the win rate and learning the breakouts tendencies starts with pre-market awareness. Not only that, halts are dramatically less likely in extended hours so rips are much more extreme.
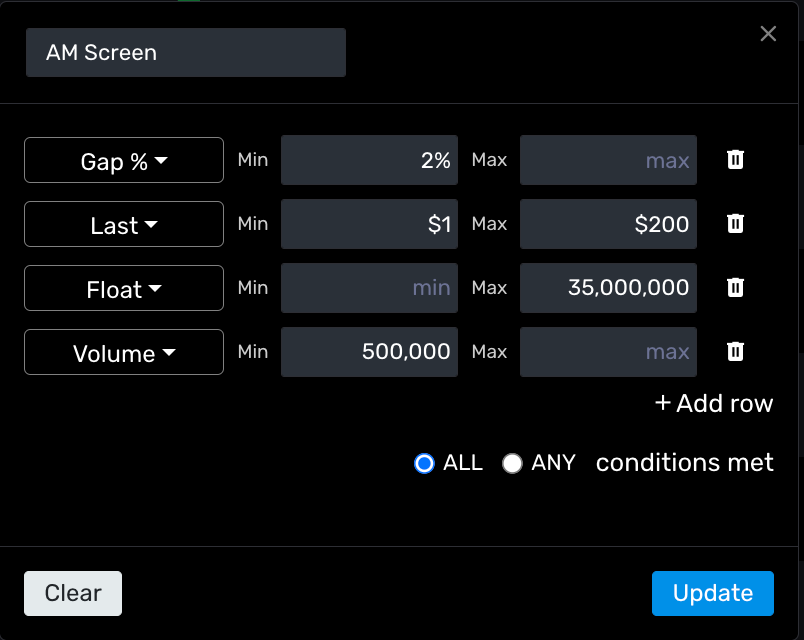
Below are the base parameters you will need (you may customize further with our library of available parameters). At a minimum, these parameters are necessary to help contribute to that scalping frenzy you want when looking for 1 min scalps.
1-min scalp screener settings:
- Look for 500k shares traded on day and Unusual Volume in the 300%+ range.
- A float of under 35 million shares
- Price range under $25 and over $2 (you may prefer lower but risk increases due to large liquidations and untimely notices of secondary offerings)
- Short interest > 2
- A Gap% of a 2% or more.
Below are some actual Discovery screener settings used for these 1min scalps.
3) Analyze Screen Results
After identifying your targeted plays you want to assess them technically and make sure there is corresponding surge of volume. Volume roughly equates to number of eyes on the trade. Not enough volume, and the trade won't work the way we planned and remember - everything done here is to a disciplined pattern. Your MOMO Pro Discovery screens can filter for min volume, but if you use unusual volume double check as it is based on change vs. historical and a 250% Uvol value may still have relatively low volume.
If the stock is showing strong volume (> 500k), you you want to be strict in your trading execution rules as well. Having the perfect set up can and will result in a negative trade as we all know.
There are 1000's of indicators, but for 1 min scalps the 9/20 EMA, 8/20 EMA or 9/21 EMA crossover are hard to beat. And seeing how this is the basis of a successful 1 min scalp we backtested various indicators using recent data across a diverse set of stocks to confirm. And as you can see these EMA crossovers are preferred for good reason.
| Strategy | Profitability | Average profit/loss (pips) | Sharpe ratio |
|---|---|---|---|
| 9/20 EMA crossover | 55% | 10 pips | 1.5 |
| 8/20 EMA crossover | 50% | 15 pips | 1.2 |
| 9/21 EMA crossover | 53% | 12 pips | 1.4 |
| 5/10 EMA crossover | 50% | 12 pips | 1.3 |
| 10/15 EMA crossover | 53% | 10 pips | 1.2 |
| RSI divergence strategy | 55% | 8 pips | 1.1 |
| MACD strategy | 52% | 10 pips | 1.2 |
| Bollinger Bands strategy | 50% | 11 pips | 1.3 |
As a reminder, the Sharpe ratio measures the performance of an investment such as a security or portfolio compared to a risk-free asset (eg. treasuries) , after adjusting for its risk. It is defined as the difference between the returns of the investment and the risk-free return, divided by the standard deviation of the investment returns.
We also decided to take these values one step further and when compared versus the expected value (EV) of each strategy, you can see that the 9/20 EMA , 9/21 EMA, and 10/15 EMA are indeed your best options.
When you plot versus EV you can see the returns relative to the probability of gains vs. the probability of losses. When performing these crossover triggers vs. across 5 trades using a $1000 we get the following EV.
| Strategy | Profit (5 trades) | Returns | Win rate | Average profit | Average loss | EV |
|---|---|---|---|---|---|---|
| 9/20 EMA crossover | $275 | 27.5% | 55% | $55 | $-5 | $27.25 |
| 8/20 EMA crossover | $250 | 25% | 50% | $50 | $-3 | $22.5 |
| 9/21 EMA crossover | $265 | 26.5% | 53% | $53 | $-2 | $24.77 |
| 5/10 EMA crossover | $250 | 25% | 50% | $50 | $-2 | $22.5 |
| 10/15 EMA crossover | $260 | 26% | 53% | $53 | $-1 | $25.21 |
| RSI divergence strategy | $225 | 22.5% | 55% | $40 | $1 | $19.5 |
| MACD strategy | $252 | 25.2% | 52% | $52 | $-2 | $23.98 |
| Bollinger Bands strategy | $255 | 25.5% | 50% | $55 | $-1 | $24.45 |
As you can see, the 9/20 EMA crossover strategy has the highest EV, with an expected profit of $55 per trade. This is because it has a high win rate and a high average profit. The 8/20 EMA crossover strategy is slightly less profitable, with an expected profit of $50 per trade. This is because it has a lower win rate and a lower average profit. The RSI divergence strategy is the least profitable strategy, with an expected profit of $40 per trade. This is due to it having a lower win rate and a lower average per-trade profit.
It is important to note that the EV of a strategy is just an average. The actual amount of money you make or lose will vary from trade to trade.
Now lets discuss trade tactics and supporting elements...
- You have your initial trading targets and know the indicators. While identifying target entries closely monitor 9/20 EMA (or other as shown) and look for bullish crossover of 9 EMA over the 20 EMA on 1 minute chart as a buy signal and use the bearish cross as a sell signal.
- Draw trend lines connecting candle wick tops and bottoms to identify support and resistance levels. Watch for breaks of these levels as alternative possible trade exits.
- VWAP has strong bounce and rejection properties. Be weary of this.
- Watch for bounces off key moving averages like the 9EMA as potential entries.
- Pay attention to whole dollar levels ($10, $15 etc) as areas of psychological support and resistance.
- Volume profile is important - look for increasing volume on upside breakouts and heavy volume on downside moves. Low volume rallies are suspect.
- Manage positions by selling partial size into strength, and have clear profit targets based on prior resistance levels.
- Consider aligning trade entries around new 5/15/30/60 minute candle opens.
- Be patient, wait for setups, and stick to your trading plan. Avoid emotional/revenge trading.
- Review daily levels from the day before and use those as targets/support/resistance.
- Wait for the first 5-10 minutes of the day to settle before making trades. Avoid chasing gaps at the open.
More on Volume Analysis:
- Increasing volume on breakouts signals strength. Low volume rallies are suspect. For example, avoiding a stock with under 200k share volume profile.
- Heavy downside volume warns of potential breakdowns. For example, noting the highest volume 1-min candle being red as a warning sign.
More on Trade Entry/Exits:
- Focus entries around new 5/15/30/60 minute candle opens. For example, watching a stock at 7:30am when new 5-min candle prints.
- Sell partial size into strength and scale out at key levels. For example, selling half position at a prior daily resistance level.
- Have clear profit targets based on previous day's support/resistance. For example, watching $15 as target since it was yesterday's high.
More on Risk Management:
- Avoid emotional trading. For example, avoiding revenge trading after a loss AND avoid ego trading after a win. Relax, reset and follow your rules.
- Wait for setups and stick to trading plan. For example, waiting 10 mins for market open volatility to settle.
- Use stops to limit losses. For example, getting stopped out at 9EMA/VWAP break to preserve capital.
- If you find yourself thinking "I can beat the trade or I'll just average in", close the trade and step away from the computer.
Hypothetical Play-by-Play - Scenario 1:
- Stock XYZ gaps up 50%+ at open to $12, but pulls back and is trading below VWAP. Wait for market open volatility to settle.
- At 9:45am new 5-min candle prints. Volume over 500k shares. Stock breaks descending ray line drawn on 1-min topping tails at $10.
- Buy breakout over $10 with stop under 9EMA at $9.80. Stock rips up to $12, a prior daily resistance level.
- Sell half position at $12 on the pause/lack of momentum. Stock then breaks over $12.
- Add back shares on new 5-min high over $12 with stop under $11.80. Stock continues running to $13.
- Sell remaining position into strength near yesterday's high of $13.50, scaling out in pieces on the way up.
Hypothetical Play-by-Play - Scenario 2:
You start the day by scanning the market for potential opportunities. In this case, you are interested in $VCIG as it has shown past strength. You note that it's currently under VWAP and EMAs, indicating bearish sentiment.
- You notice that $VCIG attempts to reach the VWAP, but it needs a higher high on the 5-minute chart and more volume to sustain the move. You mention a potential entry point between $4.23-$4.50 for $VCIG.
- As you continue to monitor $VCIG, you're looking for the bid to stack up over $4.22. You spot this and enter a trade.
- You observe the stock making a bullish crossover of the 9 EMA and VWAP on the 5-minute chart, which strengthens your bullish outlook.
- As the stock approaches $4.25, you notice hesitation and orders stacking on the ask side of the order book, so you sell your position quickly, securing a small profit and avoiding a potential reversal.
- You monitor the stock, looking for potential re-entry points, but remain patient and selective due to the overall market conditions and your earlier observations.
In this walk-through, all trading decisions are driven by technical and volume analysis and are executed with quick decision-making and strict risk management.
Hypothetical Play-by-Play - Scenario 3:
Lets say a stock opens at .50. and in the premarket it spikes up to $1.50. Then it retraces back to $1.00.
- After a few minutes it curls back up to $1.10 but then fades to $1.00 (over the course of several minutes or even an hour). The stock may test that $1.09 level but can't quite get to $1.10.
- Volume surges and the ask hits $1.10. Once the ask goes up to 1.11, the bid assuming it hits 1.10 would be sitting at that crucial pivot point. Many traders make the mistake of thinking the ask broke the pivot of $1.10 and jump in.
- What you want to see is the BID over that $1.10 level, which means $1.11. But not only do you want it over that level, you want a bigger number on that bid stack than I see on the ask. Meaning the bid should be like 40 on the bid column and the ask might have 10 next to it. That is real buying strength.
- The pivot point is the price where the stock drops and curls back up but then drops again, and can't quite break. Once it breaks on the bid, the stock has room back up the HOD. This should closely follow the 9/20 EMA crossover in practice.
In this case you could probably buy $1.12 on the ask with a great (bid) stack on the bid at $1.11 and it should spring up to $1.25 (psychological s/r), scale 50 to 75% and then retest the HOD of $1.50.
That's it to the 1 min scalping strategy. Its worth noting that this strategy also requires a particular type of trader. You must be disciplined, but you also can't be playing with scared money. Many of these scalpers also have daily targets such as $1000 or $2500 a day to help keep themselves in check.
Don't have MOMO Pro yet? Get started here!