
Why MOMO's Unusual Vol (uVol) is Most Responsive Approach

Unusual volume (uVol), sometimes called relative volume (rVol) , is a powerful way to uncover exploding market interest. The premise of uVol is that volume that is abnormal is usually correlated to an event or trend that drives incredible interest in the stock. This event could be hype around a new technology (metaverse, AI, quantum), rumor around M&A, short squeeze, or even just a large institutional trade.
In uncovering opportunities, you need to be selective and when unusual volume is used in conjunction with other indicators, you can hone in on stocks which are meaningful to your trading style. And ultimately, the sooner you can identify these opportunities, the better.
That is why we took an innovative path to identifying Unsual Volume. We also needed to be able to identify uVol in extended hours and that meant the traditional way wasn't going to suffice. So what did we do? We "time-sliced" the entire trading day.
Old way to measure Unusual Volume...
Historically trading tools (and sites) would compare current accumulated daily volume vs. average volume. This provides a coarse metric and isn't responsive to day to day variation, nor being able to vary the timeframe to visualize the velocity of the change. This presents a few problems –
1) Frequency – Given the approach, many justified a slow refresh rate that could be as long as 15 minutes or hourly. We process the entire market every minute to compare to the time frame of interest.
2) They are not time-sensitive because they measure current volume against the entire daily average volume. That is a simplistic method which does not account for the intraday distribution curve. CNBC and others use this approach and while ok for generic information, not actionable for trading.
3) As mentioned, not meaningful for extended hours. A few thousand shares wouldn't even register versus an entire day's average volume, but that same few thousand shares may indeed be anomolous relative to the time of day and potentially very meaningful.
Benefits of Time-Slicing
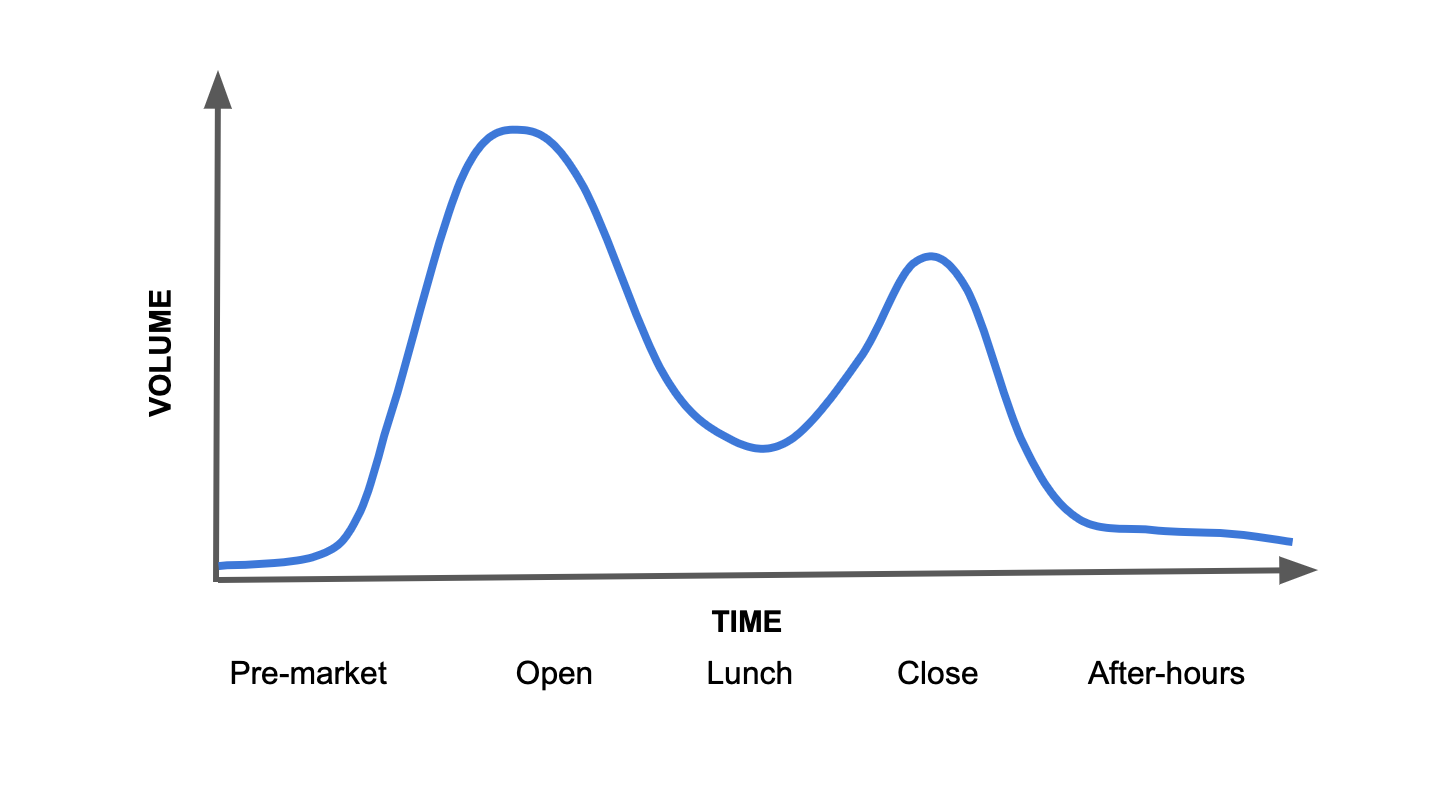
For the most part, stocks tend to follow a camel-like distribution curve throughout the day. Different time periods see different volume through course of day This makes sense. Lunchtime, Pre-market, and End of day all have unique market interest associated volume. And each stock has its own volume signature as well.
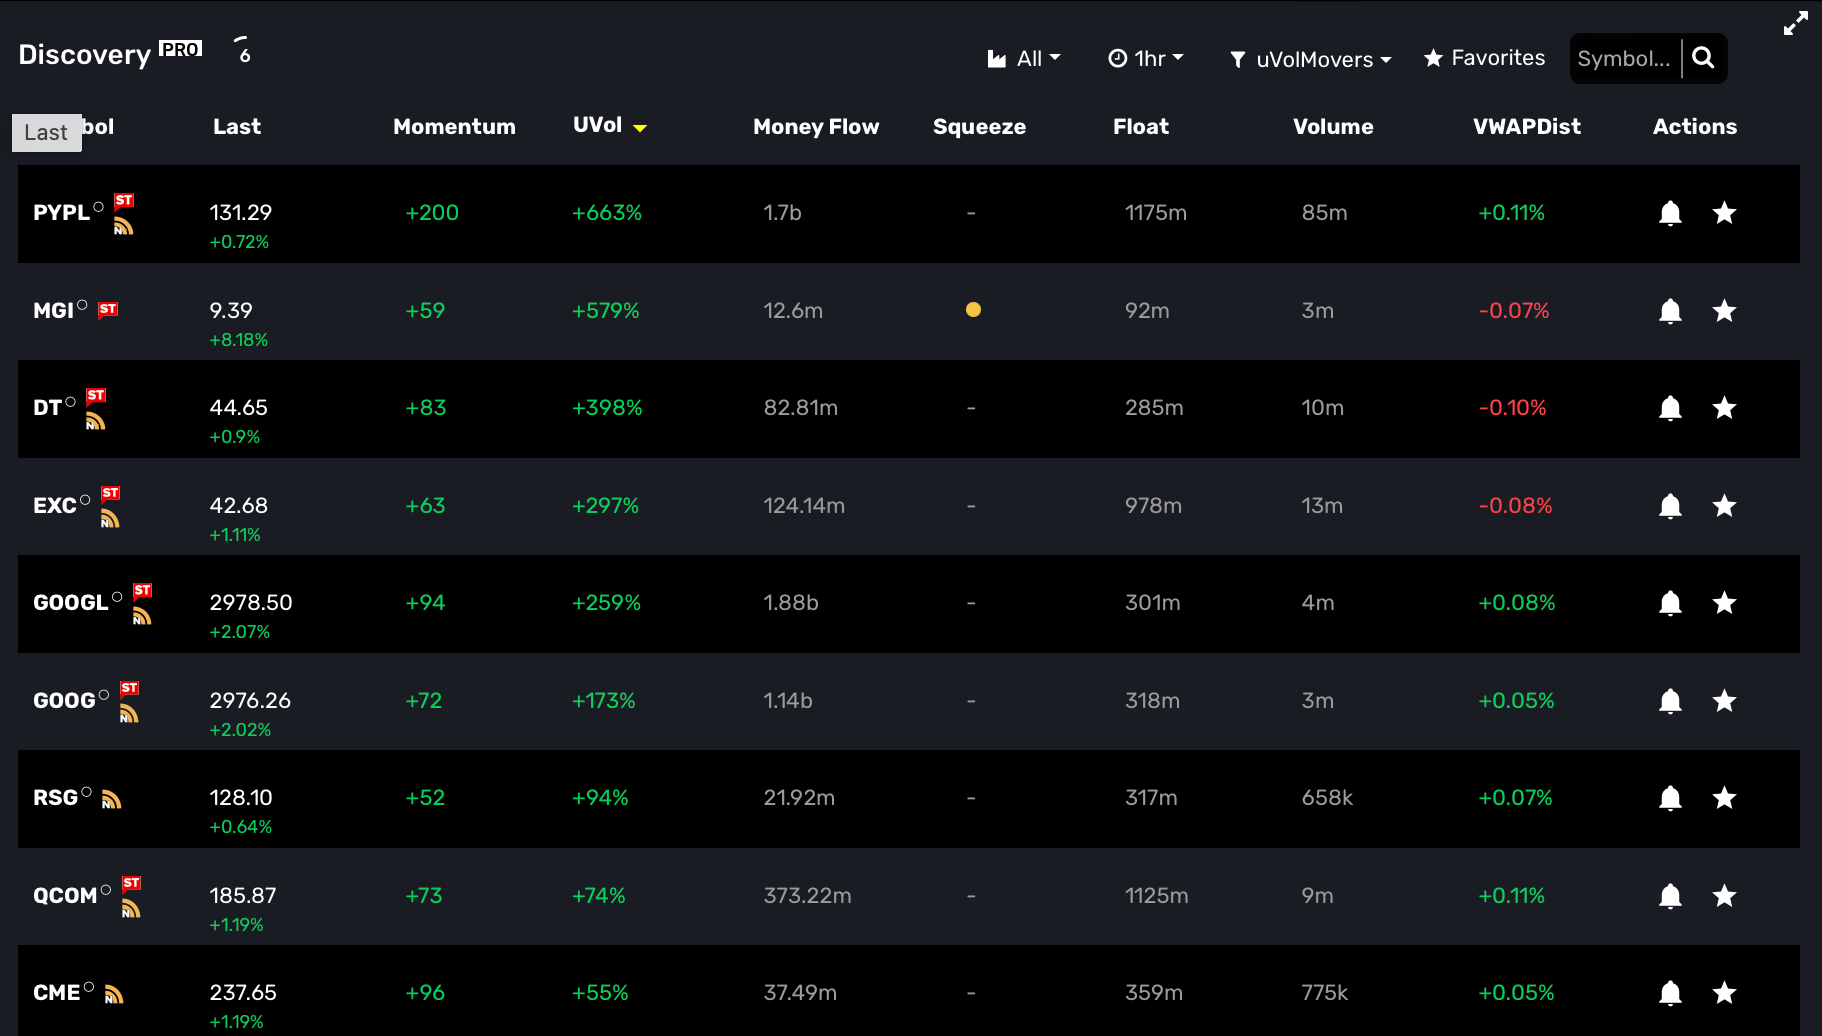
So we have sliced the entire day up into 15 minute "slices" and compare the historical 30-day volume vs. the current slice for every symbol we track (11,000+). Then we roll-up these 15 minute volume snapshots to create 30min, hourly, 2-hour, 4-hour, daily, weekly, and monthly views. This gives us flexibility regardless of market hour to provide a relative volume analysis of the timeframe.
We have a few who occassionaly think "less is better" and want 1-minute unusual volume or similar, but we found 15 minutes is very responsive and naturally smoothes out the noise. Not only are finer-grained volume signals very noisy, but(!) we are constantly evaluating current volume every minute against that 15 min historical view. What does this mean? We are refreshing the accumulated current volume for the given timeframe every minute. So if there is a significant volume surge, then it will be reflected against the 15min time slice historical volume.
We hope you enjoy the most responsive and agile UVol around.
Team @ Mometic