
Where has US Market Volume Gone?

The market has felt rather flat for a while, perhaps this is due to being in "melt up" mode from infinite dollars. Despite the 500 plus point days of drops and opportunities to profit, the electricity seems somewhat muted. So where has the volume gone?
As you know “volume” in trading refers to the total number of shares that are traded during a given period. Volume is measured across all types of financial commodities, including stocks, bonds, options, futures, etc.
The term “liquidity” is the swiftness with which an asset or security can be either bought or sold in the market for its market price. It is a close couisin to volume and plays a big part in market dynamics.
Volume: A sign of liquidity
Trade volume and liquidity are interrelated because a higher trade volume indicates a greater overall market interest for a particular stock or commodity. The stocks are getting traded more frequently and more rapidly than the ones with lower volume. So, a high trade volume is generally an indication of a high liquidity level for a particular security or commodity in the market.
As such a lower trade volume indicates a low overall market interest in that particular security or commodity. Hence, such securities are being traded less frequently.
With that said, I wanted to take a historical look at volume across various assets and indexes.
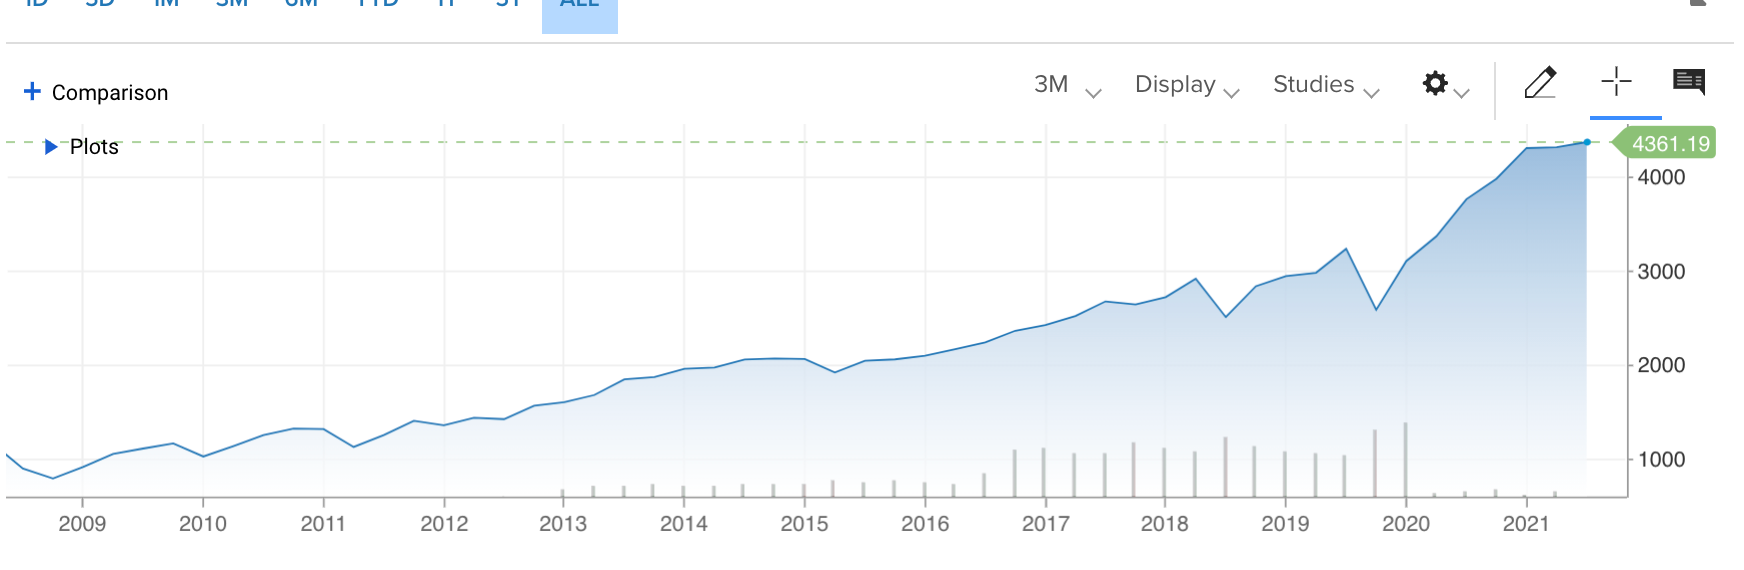
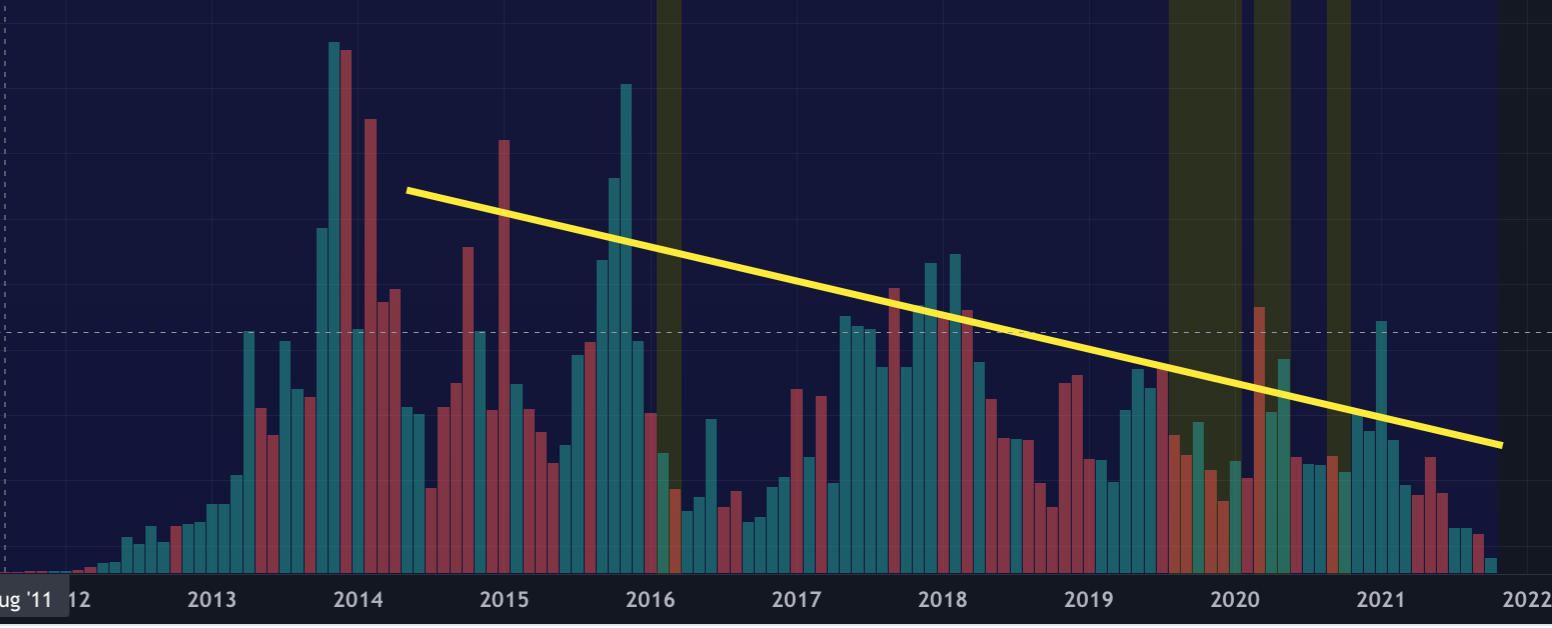
As you can see first, S&P 500 has has clearly decilined over the years. On a dollar weighted basis perhaps going from from 1000 to 4300 range attributes to it, but even CNBC's monthly chart shows a glaring difference since 2020.
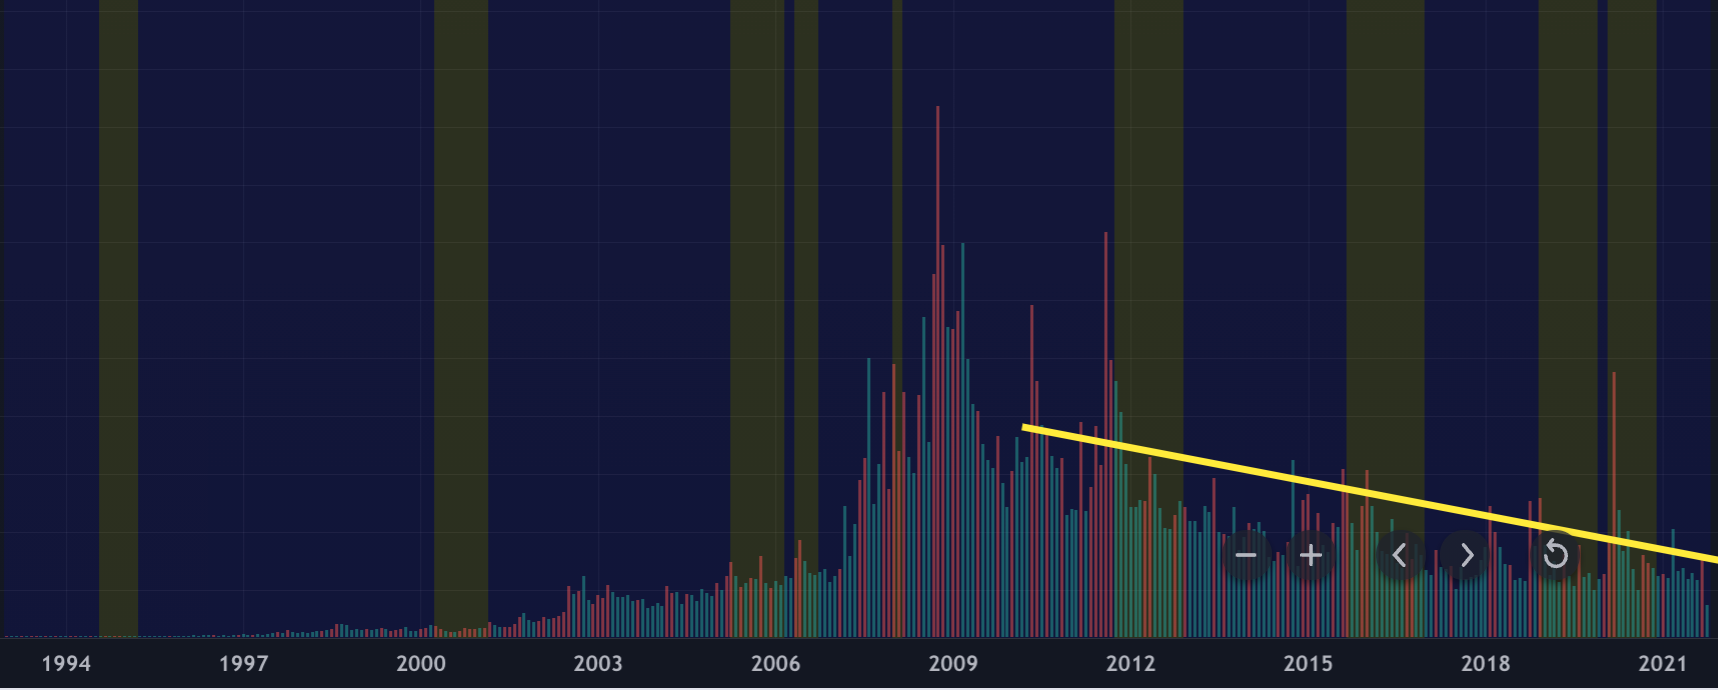
Nasdaq volume too is in overall decline, recent upticks are not unexpected, but over last decade trend is markedly down.
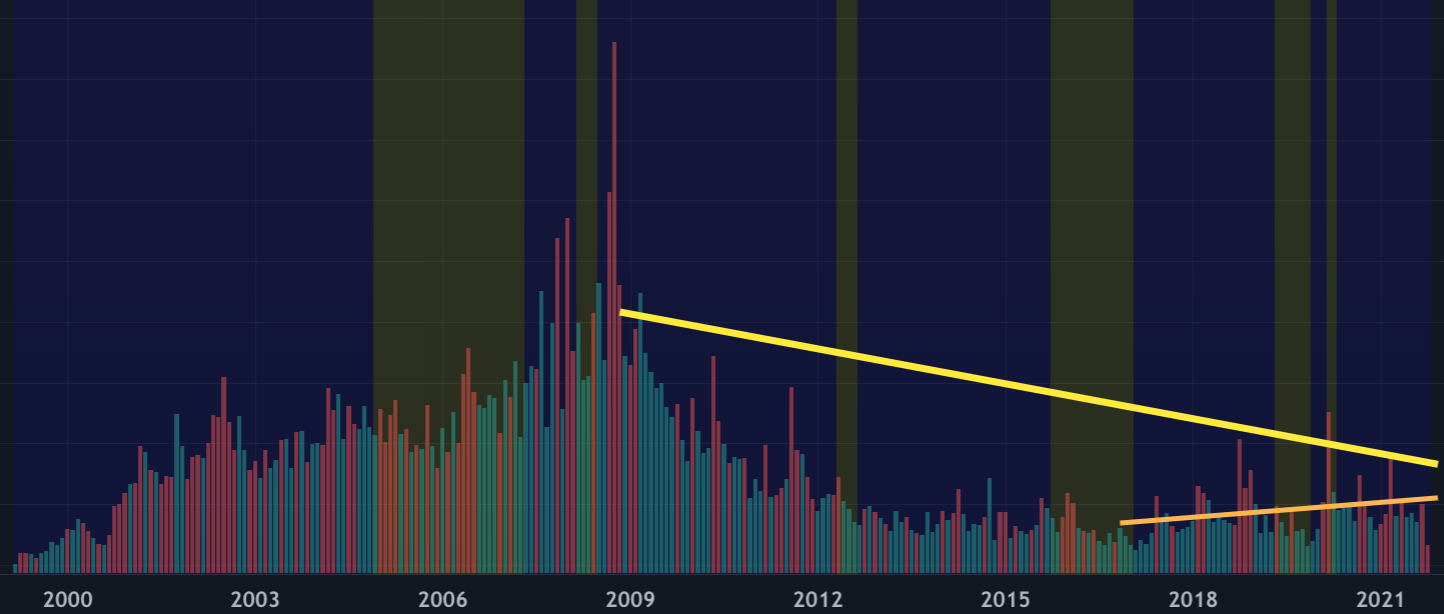
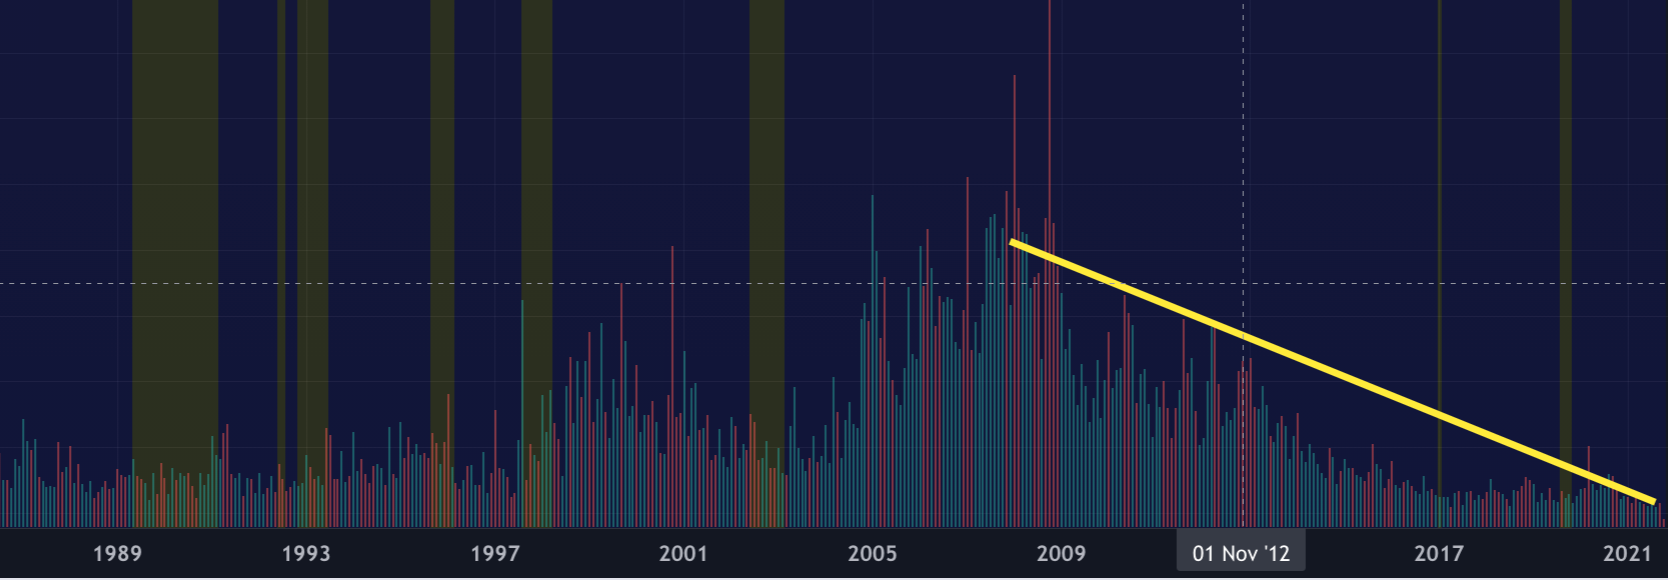
Perhaps interest has flooded to Russel 2000? Numerous biotechs and alternative energy plays are in here and could account for some of the delta, but overall trend too is down.
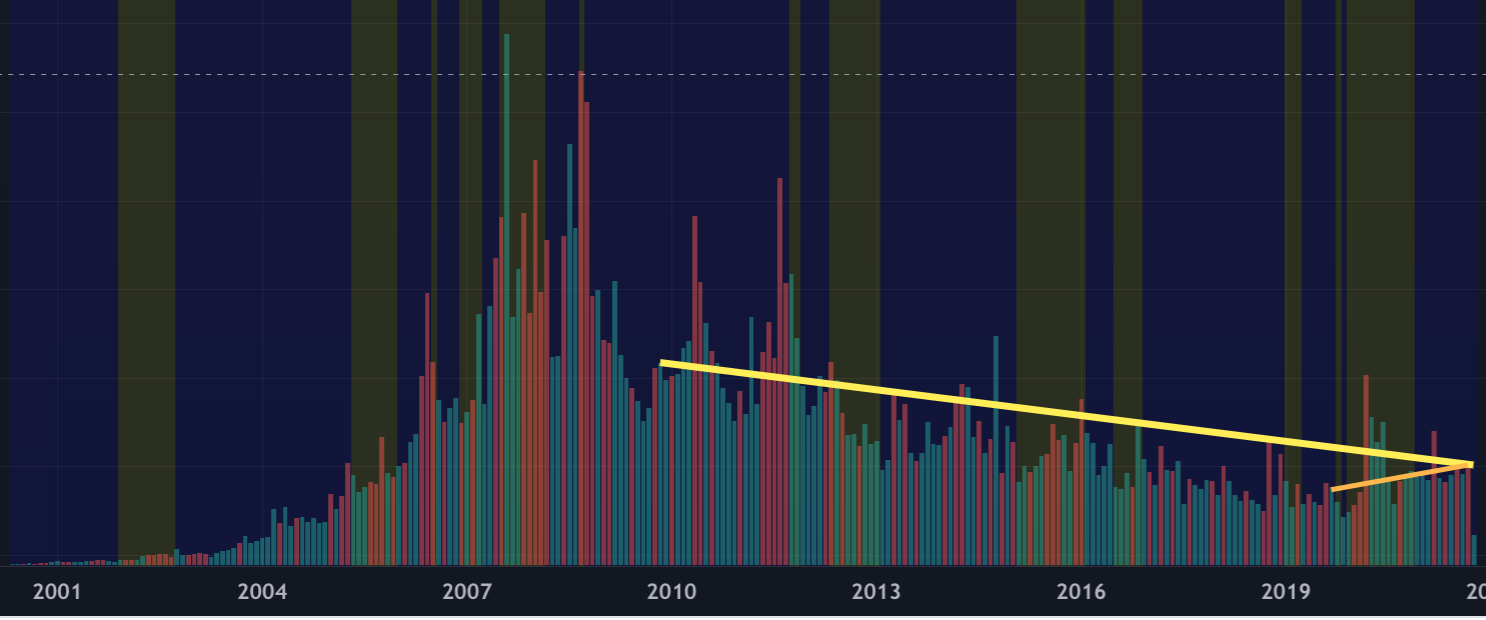
Crypto perhaps? Oddly, no. Despite increased visibility, there has been a notable decline in volume.
Despite now being a $2 Trillion dollar business, $AAPL volume has declined considerably. This is notable given highly visible retail exposure and splits to keep price relatively low.
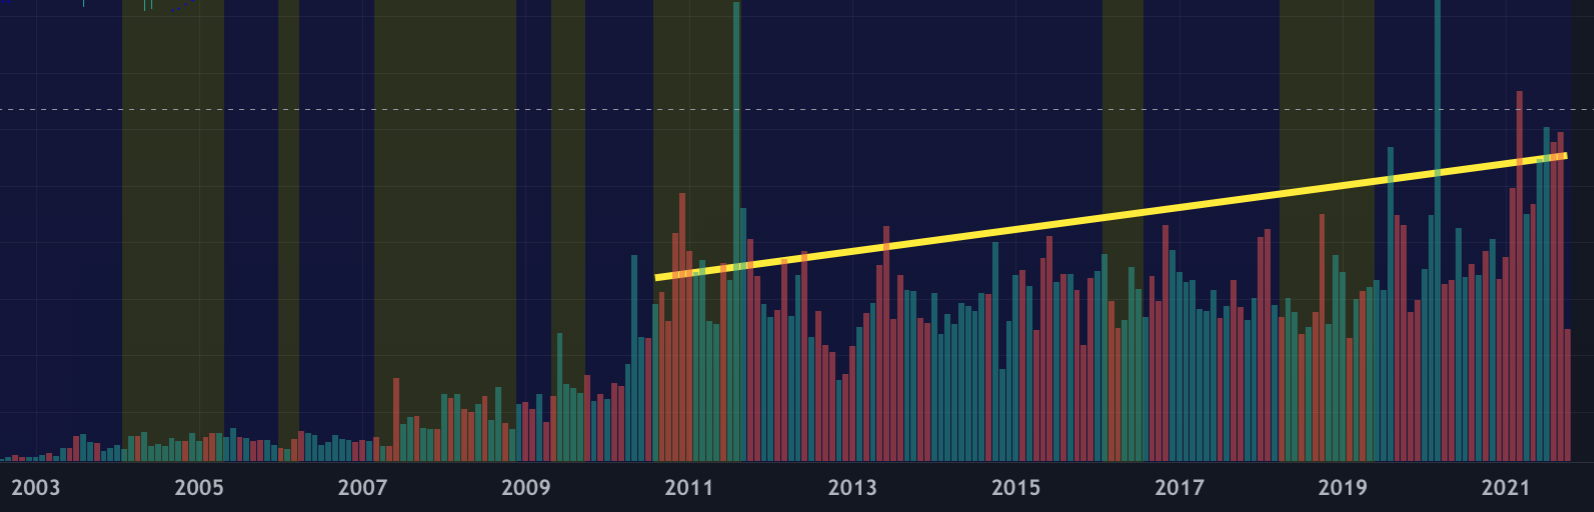
Looking outside of equities you can see there has been a notable volume increase in treasuries. This is happening in the face of increasing bond prices as well.
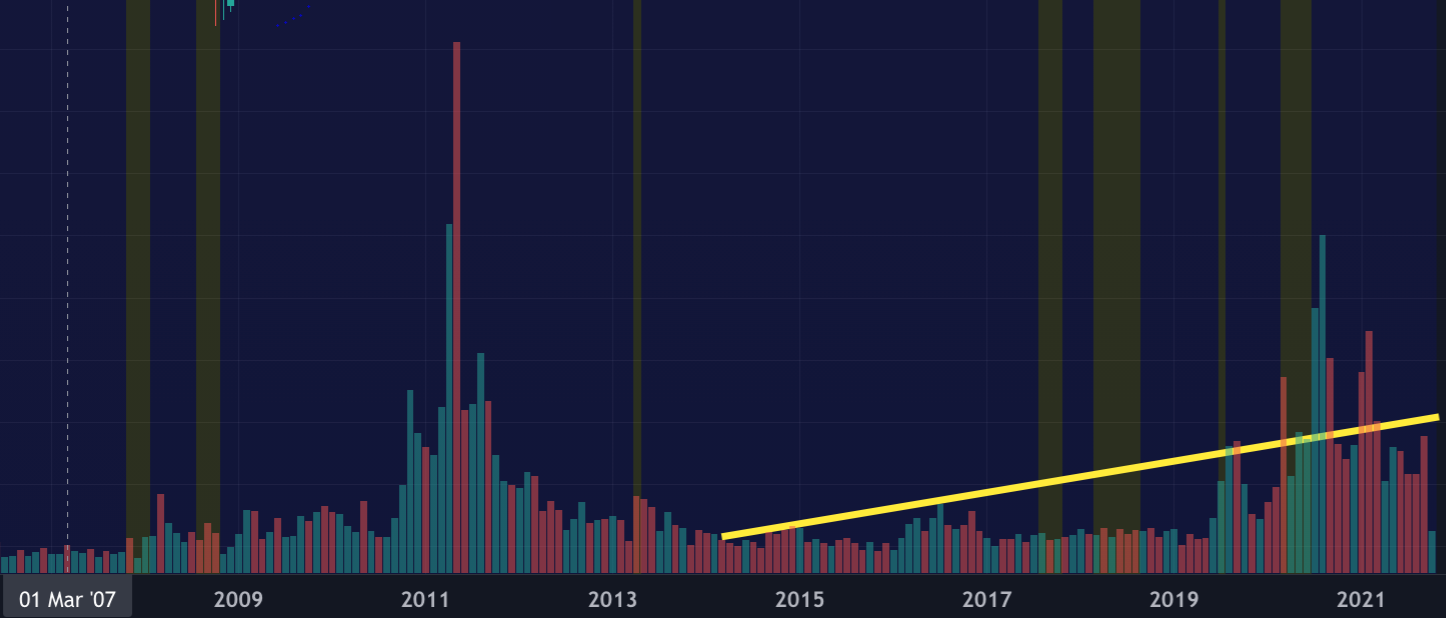
Another alternative is metals. Looking at SLV shows increasing intereston the monthly chart. A bit odd and don't have any reasoning.
Together it seems there is general flight to bonds and metals given the over-extension in equities. However, the the number of new retail investors entering the market or supposedly so should be ticking up or at least supporting the equity numbers despite being a fraction of institutional volume.
Ultimately, this decreasing trend in volume has shown to be meaningless in ability to reach new heights, but it is interesting to see how this dynamic plays out.
Have insight on why this is happening? Reach out to us @mometicmobile or hello@mometic.com