
Understanding Psychology Behind Gap Fills

There is a lot of discussion on "Gaps" lately as it seems to be the most recent misunderstood topic which to capitalize upon. While hardly new, Gaps act as a tradable indicator are part folklore and part market dynamics – a combination which makes for the perfect discussion topic.
So not to miss out on sharing our view... we are sharing our perspective on Gaps trading strategies using as in indicator.
As you probably likely aware, a Gap is an untraded, "empty", price range resulting from new data, news or sentiment while markets are closed. Period. Not many clarify this. And yes, illiquid stocks can have "gaps", but are they actually even being a tradable market at that point?
For comparison, if look at crypto markets, you will never see a gap in ETH or BTC since they trade 24x7x365, even down to 1 min timeframes. However, more obscure and thinly traded cryptos such as NANO (NANOUSD) will show gaps at 15min and lower timeframes. Also it is common to have low volume symbols in equity markets with these intraday "gaps".
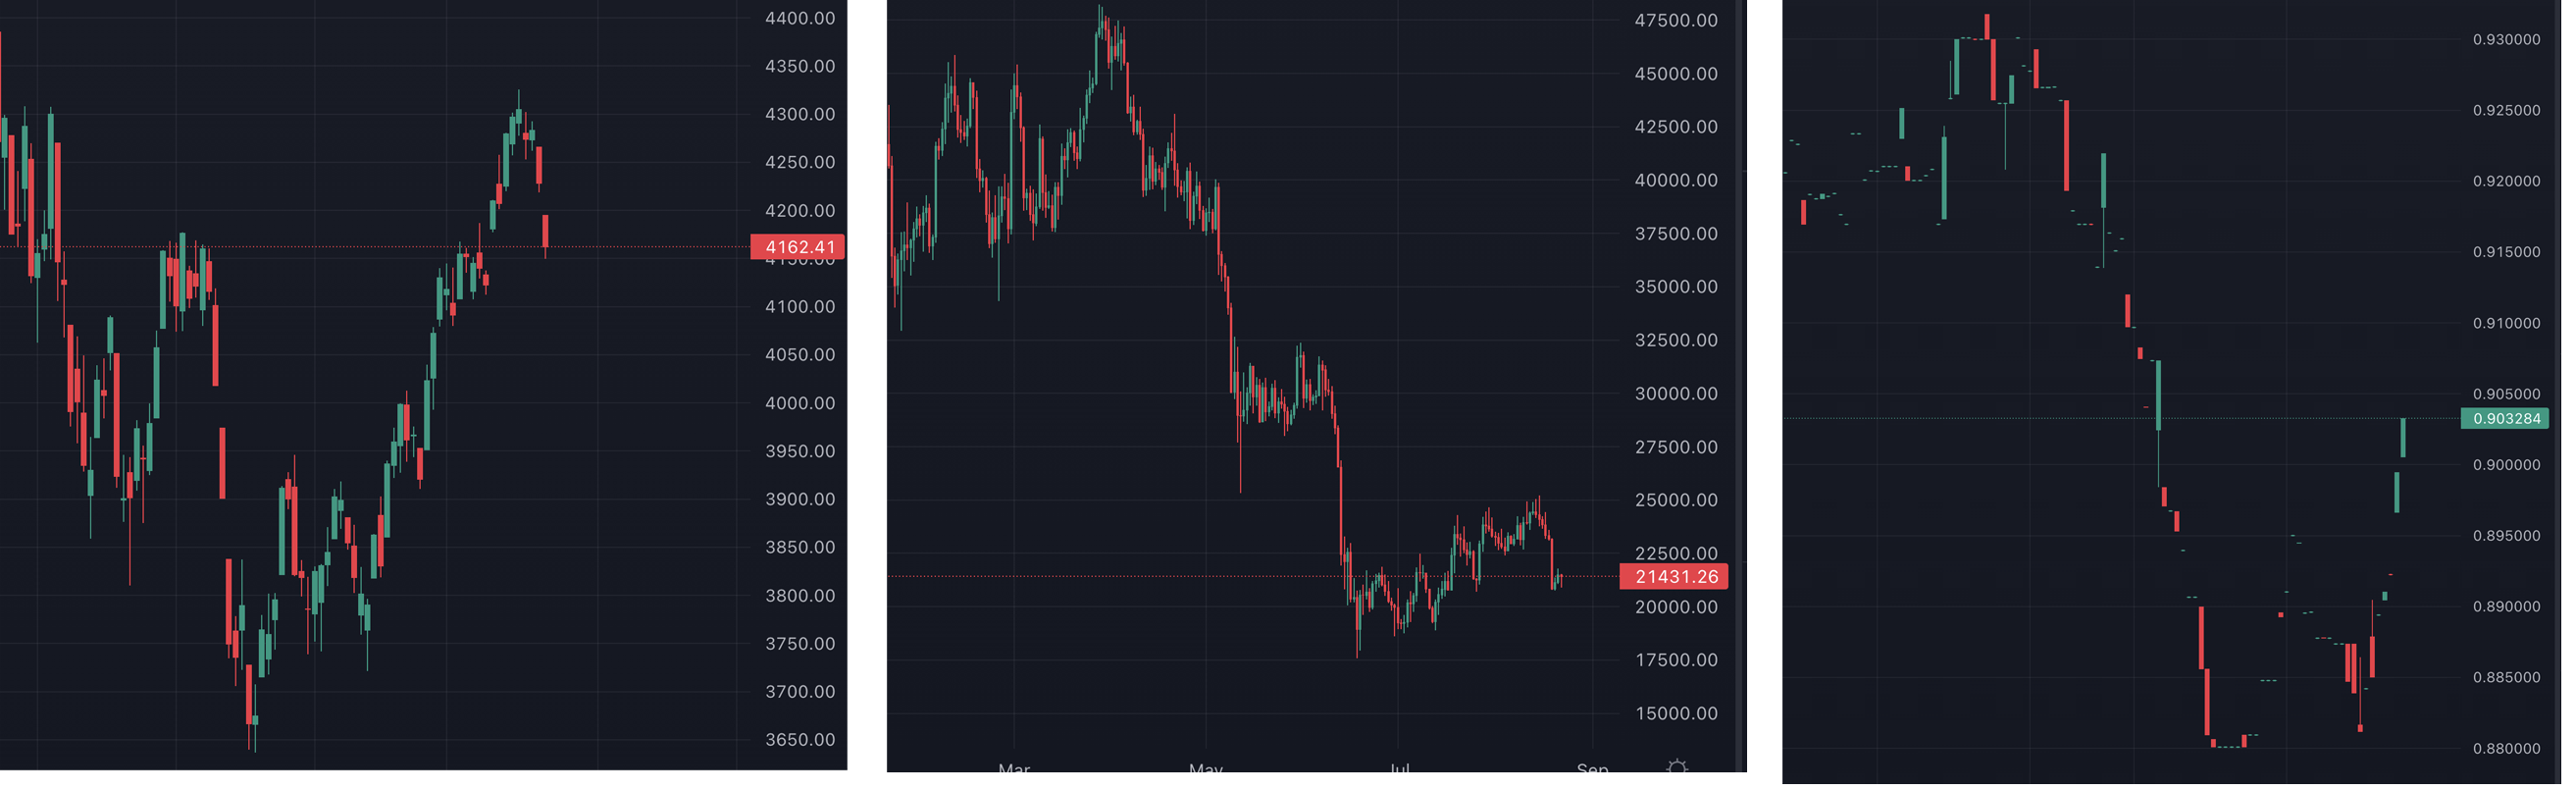
But look at SPY and you will see many gaps due to weekends, daily market hours, and holidays. It's simple enough and makes sense, right?
Trading "the Gap"
There are two main ways we believe trading the gap comes into play. We refer to them as "Gap and Go" and "Filling the Gap". These strategies are not uniquely ours and some will reference a few additional strategies, but we think these are the most battle-hardened.
"Gap and Go"
As we mentioned, most Gaps are created when markets are closed. If there is exuberance it will get noted and drive exuberance into a trade. The "Gap and Go" is fueled by excitement and genuine repricing. If a company releases stellar earnings overnight, traders who missed the initial move will jump in at the open, creating a second wave of buying pressure that pushes the stock higher, leaving the gap unfilled.
To execute, use MOMO in pre-market to scan for abnormal activity - paying particular attention to percent change. When set to the Daily timeframe you will be comparing the moves versus prior day close and this is exactly what you want to see the gappers. Use MOMO Pro+ in the pre-market to scan for abnormal activity. As shown in the Discovery screenshot below, we have a dedicated Gap column that allows you to instantly sort the market by the largest overnight moves.
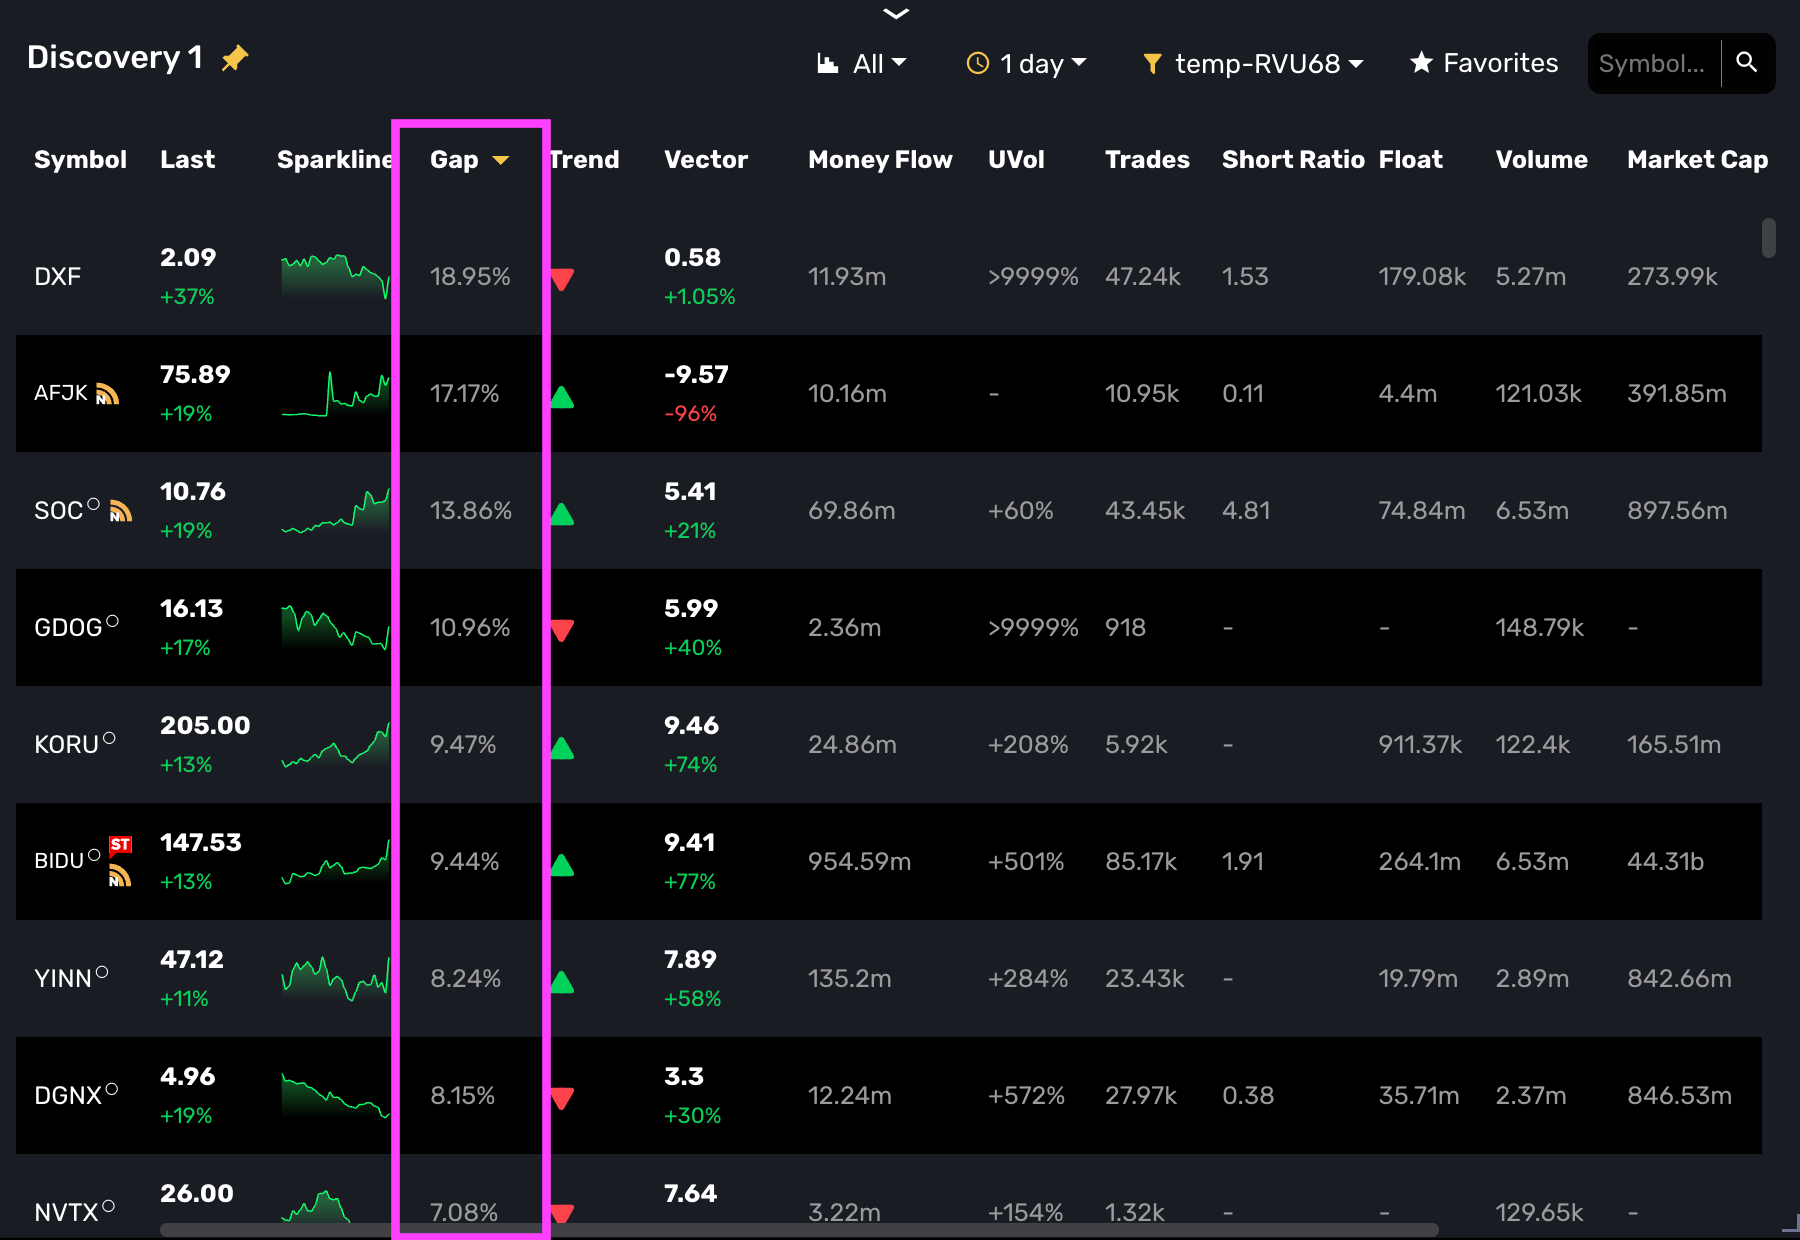
By sorting the "Gap" column in descending order (as seen above with symbols like DXF and AFJK), you can quickly isolate stocks with significant overnight enthusiasm. You are looking for high percentage gaps backed by unusual pre-market volume.
"Filling the Gap"
Filling the gap is another phenomenon that happens often enough in the markets to warrant attention.
The psychology with filling the gap is that traders who held positions overnight and woke up to a massive gap up are sitting on instant, easy profit. They sell at the open to lock in those gains, creating immediate selling pressure. Markets often overreact to news. If a stock gaps down 5% on a rumor, value investors may view this as a discount and step in to buy, driving the price back up to "fair value" (closing the gap to the previous close).
To trade this when identified, you enter a trade against the gap direction (e.g., shorting a stock that gapped up). Your price target is strictly the Previous Day's Close. Once the gap fills, the statistical edge often evaporates, and the trade should be closed. There are multiple elements you can use to identify timing here - an inverted candle on your charts, extended VWAP Dist % on MOMO Pro, or even a rush of extraordinary new highs on MOMO Stream.
| Feature | Gap and Go | Gap Fill |
| Primary Driver | Momentum & News | Mean Reversion & Profit Taking |
| Volume Profile | Exploding Volume at Open | Waning/Exhaustion Volume |
| Risk | False Breakout (Bull Trap) | Trend continues against you |
| Best For | Hot sectors, Earnings beats | Over-extended moves, insignificant news |
The "Why" Behind Gaps
Here is a bit more on the mechanics or psychology behind gaps. On the surface you see these empty untraded zones in charts, but you should understand the auction theory that is actually occurring underneath.
Intraday: Validating for Balance
Why is the expectation for a gap to close so strong? It comes down to fair value and the market wanting assurance the move was warranted.
If a stock moves 5% overnight, that move occurred in a low-liquidity environment. The market often assumes this price change was "artificial." The market naturally wants to revisit the previous day's closing price to test for balance between buyers and sellers. It needs to verify if the demand is real.
If the gap was indeed "real" they won't close if the fundamental value of the company has shifted overnight (e.g., massive earnings beat or a buyout rumor). In these cases, the "fair value" has officially changed, and the market has no interest in testing the old prices. The market will be the judge.
Longer Term: The "No Man's Land"
On a longer time horizon, a gap represents a structural void in the chart. Because no trades occurred in that price range, there is no "price memory"—no bag holders looking to break even, and no accumulation zones. Without support or resistance to act as friction, price often moves back through the gap area rapidly. Because why not, right? If doing technical analysis you likely are not drawing lines in the middle of the gap, right? You are looking for value which is likely the bottom of the gap.
Traders know this area is slippery. They often wait on the sidelines until the gap is fully closed or a defined new level of support is established before committing capital.
Lastly, if you are looking for action stocks with some Gap on the day are usually strong contenders regardless of strategy as they are "in-play". Using a small Gap% value in MOMO Pro+ filters helps here.
Don't have MOMO Pro+ yet? Get started here!