
Understanding Fair Value Gaps (FVG): A Guide to Micro Market Imbalances

If you’ve been digging into price action strategies or chatting with the momentum traders, you’ve likely stumbled across the term "Fair Value Gap" (FVG) also called a liquidity gap. It’s one of those concepts that sounds fancy but, once you break it down, becomes a game-changer for spotting opportunities and positioning. Today, we’re diving into what FVGs are, what they tell us about market dynamics, a couple of real-world examples, and—how you can weave them into your trading. Let’s begin...
What Is a Fair Value Gap?
A Fair Value Gap is a price action that highlights small inefficiencies or imbalances in the market. For example, the market’s humming along, and suddenly—a large candle rips, leaving a "gap" where price jumped so fast that buyers and sellers didn’t fully overlap.
Technically, FVGs show up in a three-candle sequence: a large impulsive candle flanked by two others whose wicks don’t fully cover the range of that middle mover.
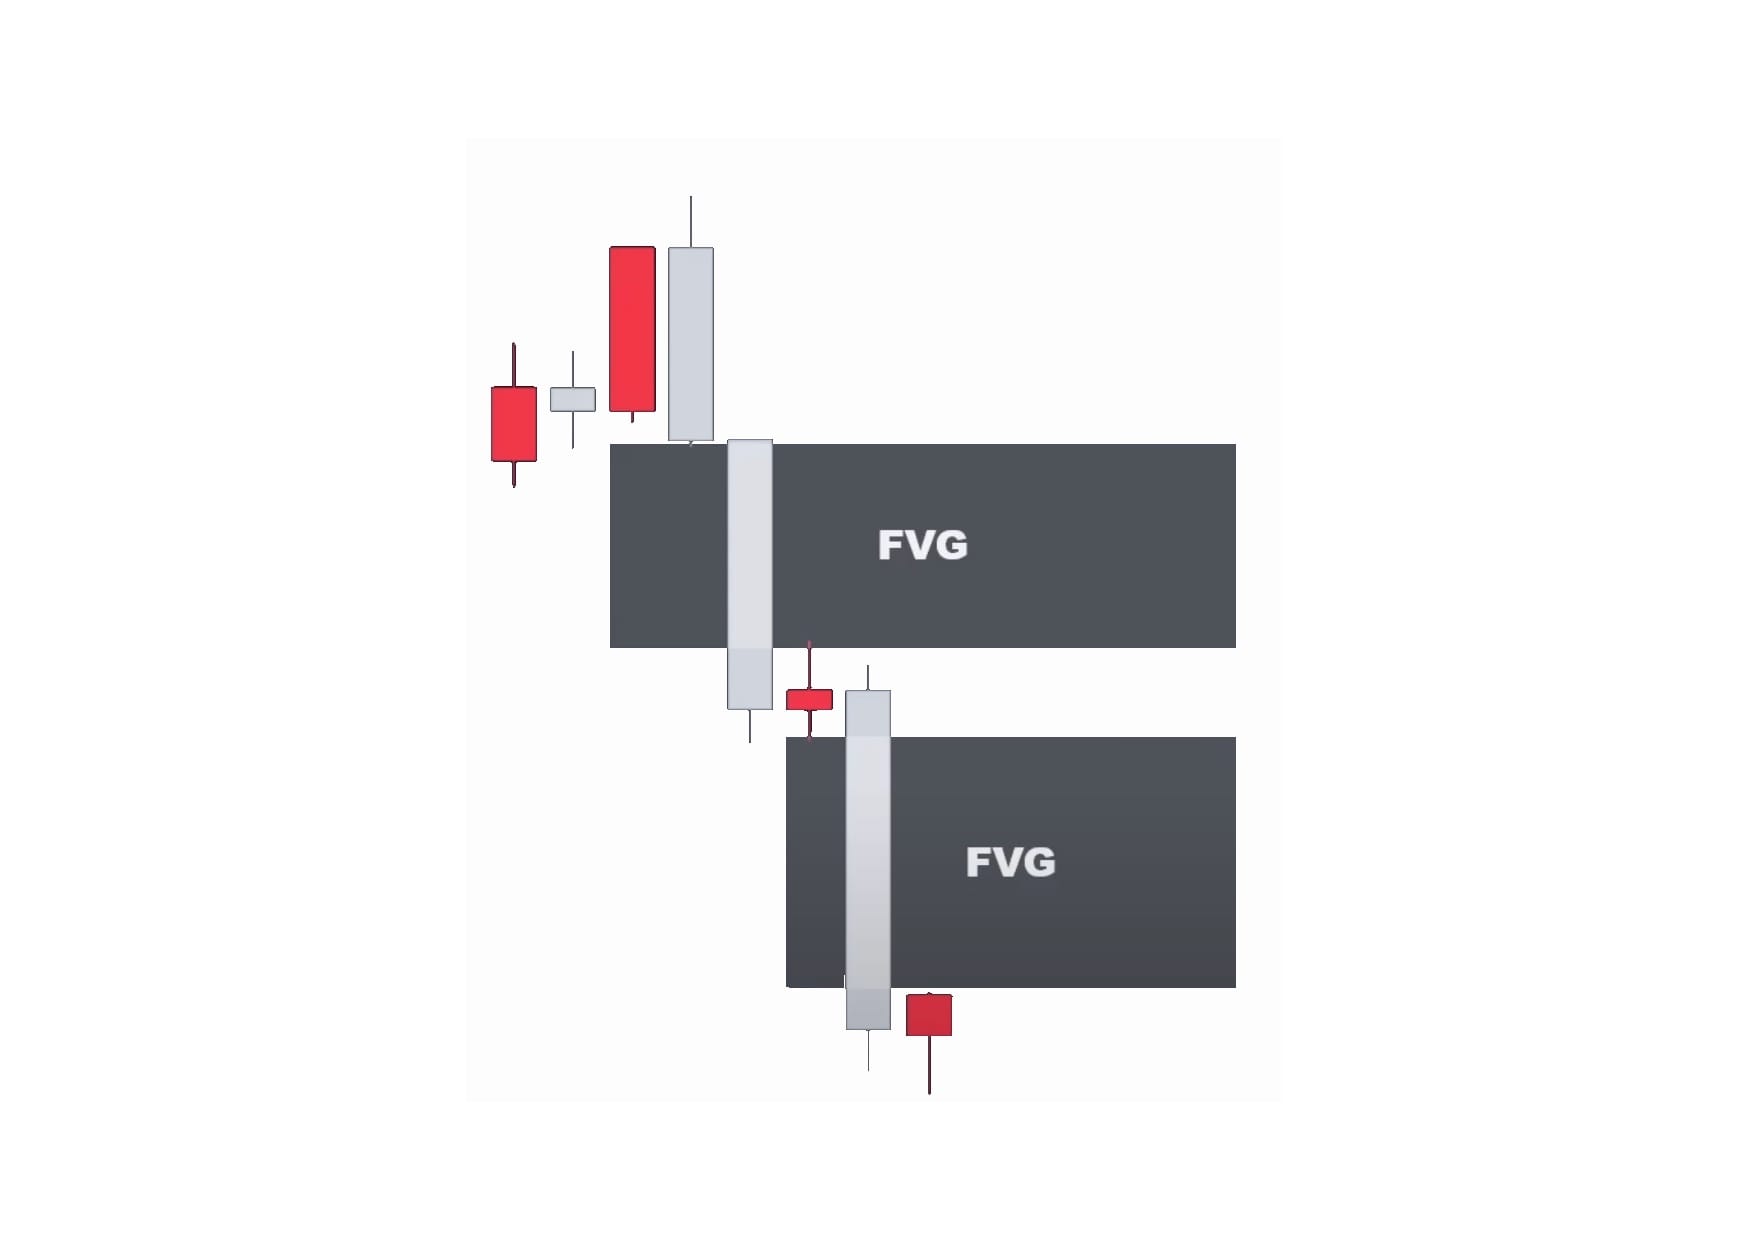
This gap is the FVG—a zone where trading activity was thin, signaling an imbalance between supply and demand.
What does this imply? Markets hate imbalances. That gap often acts like a magnet, drawing price back to "fill" it before continuing its journey. For momentum traders like us, it’s a heads-up: something big happened here, and the market might revisit this level to resolve the tension. Think of it as the market’s way of saying, “Hey, we moved too quick—let’s double-check that spot.”
Why FVGs Matter to Traders
FVGs are more than just chart fodder—they’re a window into market psychology. When price rockets up or down, leaving an FVG behind, it’s often a sign of aggressive buying or selling (think institutional moves, short covering, or news-driven spikes). The implication? These zones can become key levels of support or resistance, or even entry points for trades. Price tends to retrace to FVGs to "test" them, either filling the gap and reversing or filling it and powering through in the original direction.
Even with trades above and below, the untraded zone’s a blind spot—no volume, no bids or asks executed there means no data on its structural durability.
NOTE: These "gaps" in reality are different from daily gaps in charts. It doesn't mean no trades have occurred, but stops and wide spreads have created exaggerated candles with few trades relative to other moves of security.
For us at Mometic, it’s another layer of momentum insight—pair it with tools like our new Vector Indicator, and you’ve got a recipe for precision for validating when and where these FVG's are about to be in-play.
Examples of Fair Value Gaps in Action
- The Bullish FVG Scenario
Imagine you’re watching a stock like NVDA on a 5-minute chart. It’s been grinding sideways, then boom—a massive green candle shoots up from $150 to $153 on a volume spike (thanks, MOMO Flow, for flagging that!). The candle before it topped out at $150.50, and the one after starts at $152.50—leaving a gap between $150.50 and $152.50. That’s your FVG. A few bars later, price pulls back to $151.50, right into the gap, and holds. Traders jump in for a long, and NVDA rips to $155. The gap acted as support, signaling the bulls were still in charge. - The Bearish FVG Setup
Now flip it. Say TSLA’s holding at $220 on a 15-minute chart and a big red candle dumps it to $216. The prior candle’s low was $219.50, and the next one opens at $217—there’s your FVG from $217 to $219.50. Price bounces a bit, then retraces to $218, hits resistance in the gap, and drops to $214. Sellers smelled blood, and the FVG marked a ceiling for the move.
These examples show FVGs aren’t just random—they’re signals of market intent.
Tactics for Using FVGs in Your Trading
So, how do you trade FVGs? These are not make or break plays but should be aligned with your style and timeframes. Here’s a breakdown:
- Scalping (1-Minute to 5-Minute Charts)
If you’re a scalper banging out quick trades, FVGs on short timeframes are your bread and butter. Look for gaps forming off sudden momentum bursts—pair them with MOMO Pro’s 1-minute Discovery timeframe and volume spikes. Enter when price retraces to the FVG, set a tight stop outside the gap (say, 0.5% below for longs), and target the next key level. Quick fingers are obviously needed here; these gaps can fill fast in choppy markets. - Day Trading (15-Minute to 1-Hour Charts)
For day traders, medium timeframes balance frequency and reliability. Use FVGs to confirm trend direction—say, a bullish gap in an uptrend. Wait for the retracement, enter with a stop beyond the gap, and trade the move to prior recent high. - Swing Trading (4-Hour to Daily Charts)
Swing traders can zoom out and hunt FVGs on bigger timeframes. These gaps often tie to major news or macro shifts, making them stickier. If price fills the gap and holds, it’s a signal the trend’s got legs. Set wider stops (1-2% outside the gap) and aim for larger targets—think 2x or 3x your risk. Discovery’s 4-hour view can help you filter these setups.
Pro Tip: If not clear from above, don't trade FVGs blindly. Stack the deck with confirmation—volume surges, momentum shifts (hello, MOMO Vector), or support/resistance zones. And always manage risk; not every gap fills on your schedule.
Wrapping It Up
Fair Value Gaps are like hidden treasure maps on your charts—finding them and positioning can lead you to some serious wins. They reveal where the market got ahead of itself and hint at where it might head next. Whether you’re scalping intraday pops or swinging for multi-day gains, FVGs adapt to your timeframe and style.
If nothing else, take away the notion that these thinly traded candles will likely be revisited and that rip or dump may get quickly tested.
Have thoughts on FVGs? Drop them in the comments or hit us up in MOMO Chat. Don't have MOMO Pro yet? Get started here.
//Profit from Momentum
The Mometic Team