
Number of Trades Now Available in MOMO Pro+


There are dozens of great trading opportunities every day. Our role at Mometic is to filter through the noise of the markets and narrow in on the best setups. While this may seem obscure, the process is painless once you get up to speed and our new "Number of Trades" parameter is one powerful tool to help.
Every good scan starts with the proper scanning criteria. There is no “one-size-fits-all” scan, as all traders have different styles and strategies. We often get asked - "What's a good scan?" and that is hard for us to answer as everyone has their own view of what they like.
If you are new to the scanning, realize this is only one piece of the equation. There are other nuances which you should also learn - perhaps even before continuing. If you are familiar with scanning and are among those who appreciate the hard to find value of the Number of Trades filter then read on!
Number of Trades
Trader interest is one of the most important components of trading. This is where number of trades comes in and shines above indicators like Volume. Number of trades shows the relative interest in time as well as versus peers.
The “number of trades” filter helps traders measure the trader interest and liquidity of a stock. This metric calculates the number of buy and sell orders for a given time period. Once again, this can be far more powerful than a simple volume indicator. For example, a stock may have traded 1,000,000 shares, of which 500,000 came from 5 block trades. In this aspect, the volume indicator can be deceiving. But, the “number of trades” value would help you see the true interest in a stock.
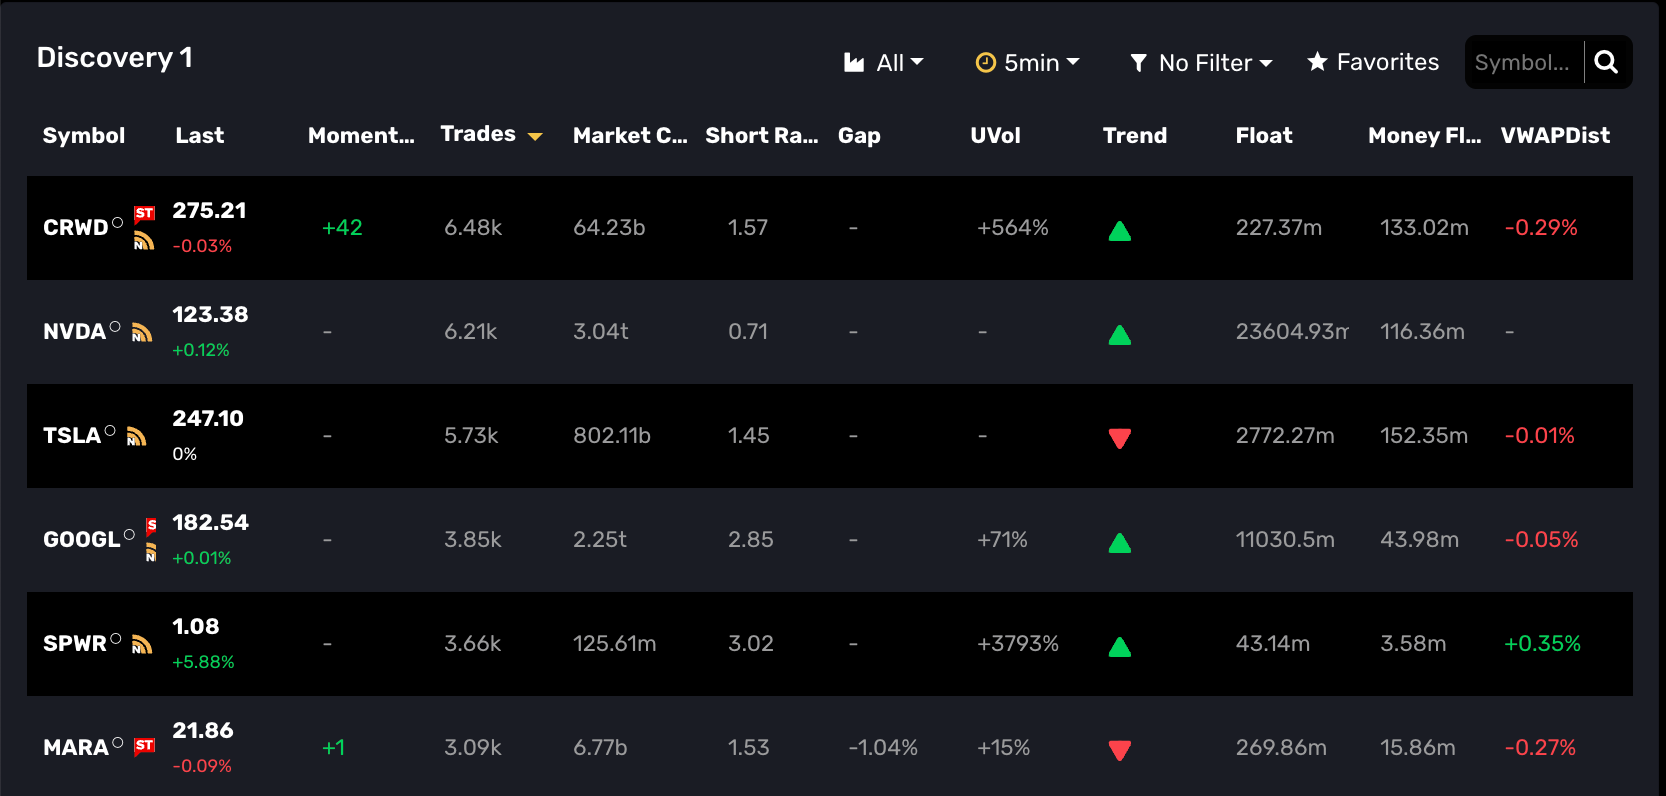
As of today our Number of Trades indicator is available in MOMO Pro+! You can incorporate this as a filter in Discovery as shown below as well as use as a parameter for your push notifications within Conditional alerts.
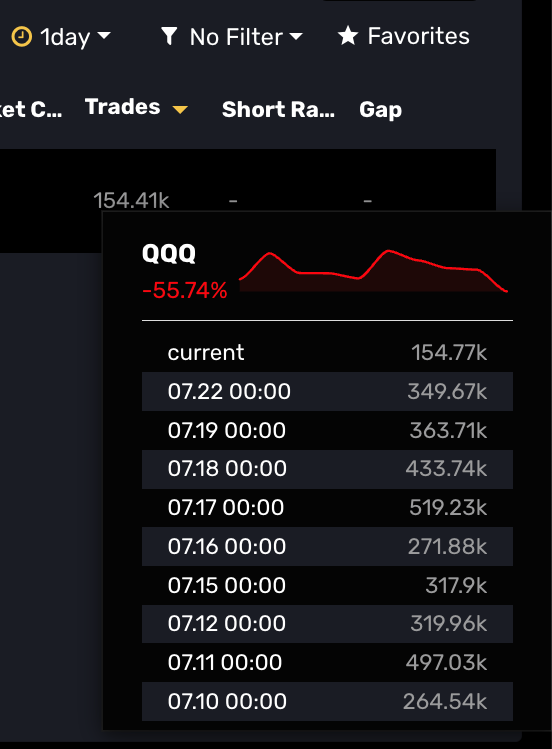
Being able to see the historical number of trades is also unique to MOMO Pro+ Simply click the cell of interest in Trades column and the historical pop-up will appear.
Money Flow / Dollar Volume
A "cousin" metric of Number of Trades is "Money Flow". This metric takes slightly different approach by incorporating the stock price. To calculate a stock’s Money Flow, simply multiply the time frame's volume by the VWAP value for that timeframe.
Money Flow is also useful because it can help equalize stocks interest across a broad price range. For example, if you simply scanned for stocks under $50 with 1,000,000 in volume, you would get a wide range of results. A stock trading 1,000,000 in share volume at $1 per share would only be trading $1,000,000 MoneyFlow, which isn’t very significant. A stock trading 1,000,000 in share volume at $50 a share would be trading $50,000,000 Money Flow, which is far more significant. In this particular example, you could remove your 1,000,000 volume filter and replace it with a $10,000,000 Money Flow filter. This will allow you to highlight better trading candidates.
With either value you can drill down and see the rate of change or them use to build a Conditional notification. If you use Trades % or Money Flow% you can filter base on having a max or min rate of change vs. prior timeframe which is useful for catching rapid change in interest.
Don't have MOMO Pro yet? Get started here!