
MOMO Gamma: GEX Levels on Your Chart in One Click
MOMO Gamma reads the options market behind your stock and draws the call wall, put wall and gamma flip on your MOMO Pro chart, with five plain lines on what dealers are doing.

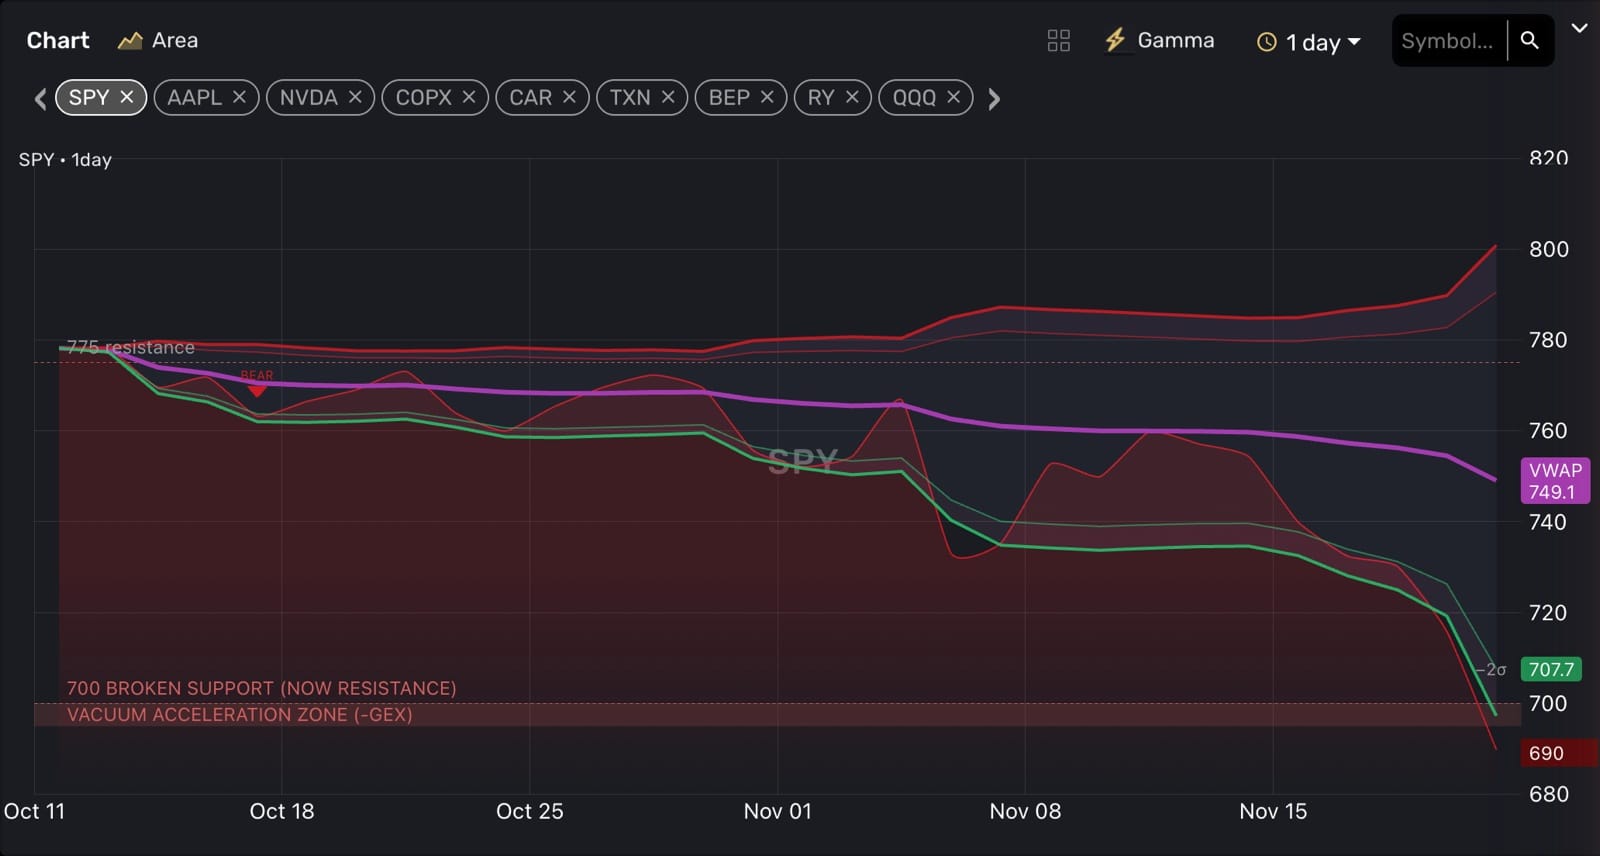
Friday afternoon, SPY was sliding toward 690. Every trader watching asked the same question: is this a dip to buy, or is the floor giving way?
The deeper insight was in the options market. SPY alone had 3,419,477 open option contracts across the next four expirations. You can work through that chain by hand, strike by strike, or you can click the Gamma button in MOMO Pro.
MOMO Gamma reads the options market behind the stock on your chart and draws what it finds onto that chart: the levels where price tends to stall, the level where moves start to speed up, and analyzes the structure to determine what market dealers are likely to do next.
The two-minute video below walks through Friday's SPY move. The rest of this post covers what MOMO Gamma shows, how to read it, and how to use it.
MOMO Pro Ultra Gamma Explainer
What is GEX (gamma exposure)?
When you buy an option, a market maker usually takes the other side. Market makers don't want to bet on direction, so they hedge by buying or selling the stock itself. Gamma measures how much that hedge has to change when price moves.
GEX aka gamma exposure, analyzes this up across every strike. At each strike, MOMO Gamma takes the value. times open interest times 100 (one contract covers 100 shares) and counts puts as negative. It determines the expirations with the most impact as well as the strikes and provides how the dealers must react to be neutral.
Once analyzed we can determine the walls and where dealers must react.
- Call wall: the strike with the most positive gamma. Dealer hedging likely selling into rallies, MOMO Gamma marks it as resistance.
- Put wall: the strike with the most negative gamma, marked as support. When price breaks through it, the same level will often turn into resistance.
- Magnet: the strike with the largest gamma. Price tends to be magnetized toward it.
The gamma flip: when moves calm down and when they speed up
The gamma flip is the price where total dealer gamma changes sign.
- Above the flip, dealers trade against the move: they sell rallies and buy dips. Price tends to calm down and hold a range.
- Below the flip, dealers trade with the move: they sell as price falls. Drops tend to get faster.
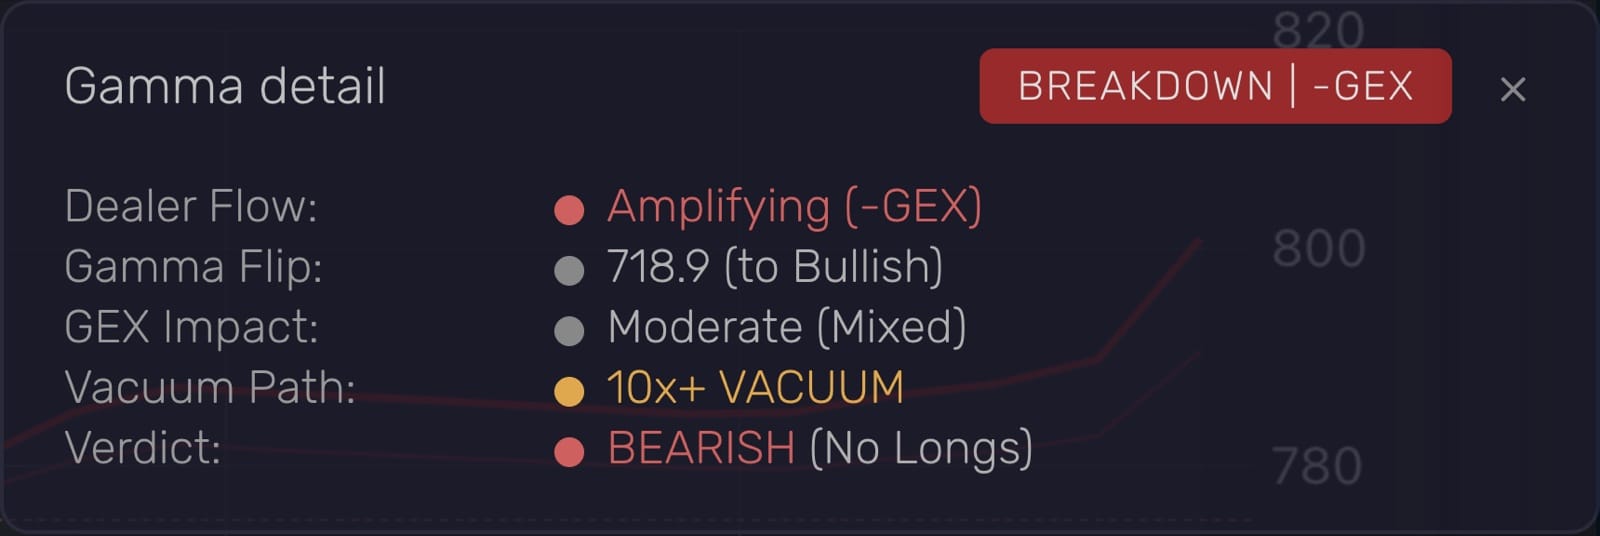
On Friday, SPY's flip sat at 718.9. SPY closed at 689.81, well below it, in the zone where dealer hedging adds to the selling.
Understanding the MOMO Gamma details
Open the Gamma detail card and MOMO Gamma sums up the options status with 5 values.
- Dealer Flow: are dealers calming the move (Stabilizing, +GEX) or feeding it (Amplifying, -GEX)?
- Gamma Flip: the price where that changes.
- GEX Impact: whether options are driving this stock today, from Low (Spot-Led) to High (Options-Led).
- Vacuum Path: how clear the road is to the next level. A high reading means little gamma stands in the way.
- Verdict: the consensus analysis.
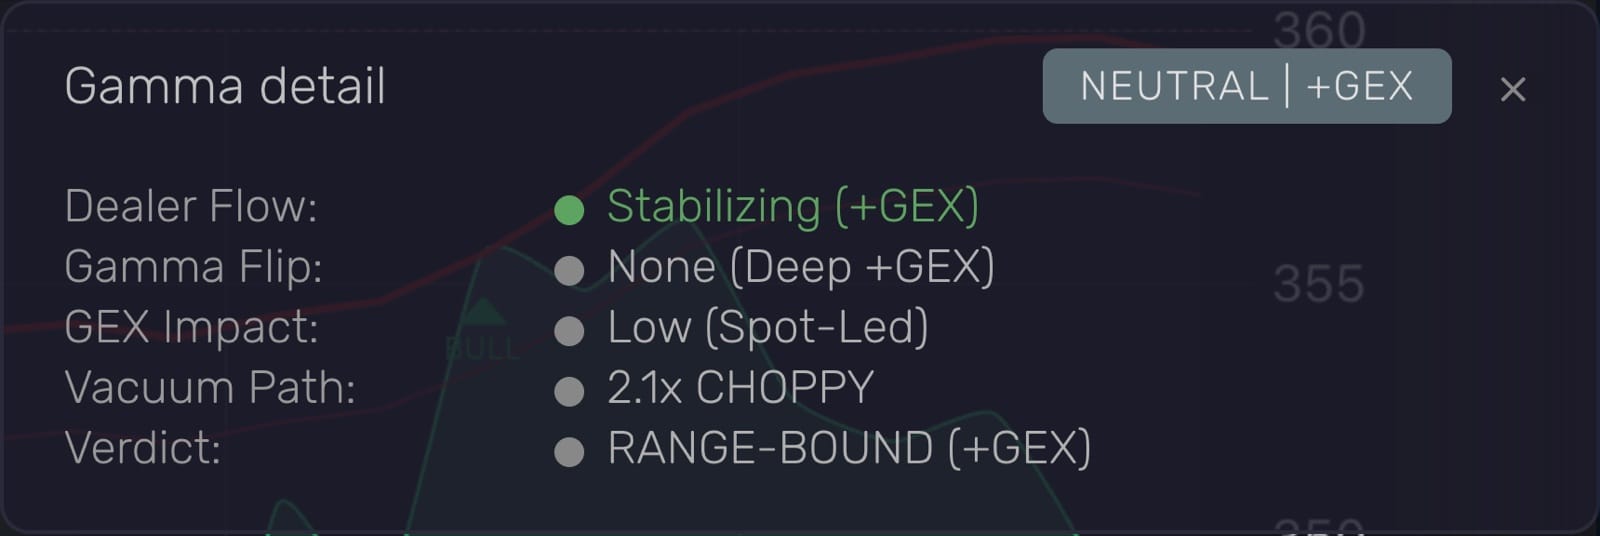
For Apple the analysis was different. Dealers were stabilizing, and there was no flip in range, and options weren't disctating the action. The verdict was Range-Bound.
How to use MOMO Gamma in your trading
- Plan entries, targets and stops around the walls. A call wall overhead is a natural place to take profits. A put wall below is where you watch for a bounce, or for a break.
- When Dealer Flow says Amplifying, size down. Moves below the flip tend to run further and faster than usual.
- With a wall overhead, don't chase. Buying straight into the call wall means buying where dealers tend to sell.
- When GEX Impact says Spot-Led, set the options story aside and trade the tape. Options aren't steering that stock today, so price action, volume and news matter more.
Use Gamma alongside what you already watch in MOMO Pro: the Stream of new highs and lows, alerts and news. It doesn't replace them.
Why traders use MOMO Gamma
- One click, no spreadsheet. No option chains to export and no formulas to maintain. One mistyped cell can move a level by a full strike; MOMO Gamma does the math the same way every time.
- Levels on the chart you already use. Walls, magnet and flip land on the MOMO Pro Chart panel, labelled in words like "700 broken support (now resistance)".
- Plain English, not a heat map. Five lines tell you whether dealers are calming the move or feeding it, and whether options matter for this stock today.
- Next to your scanner. Gamma sits in the same workspace as the real-time Stream, Discovery, alerts and news, from 4am to 8pm ET, in any browser on desktop, tablet or phone.
MOMO Gamma is only available in MOMO Pro Ultra
Ultra is our premier MOMO Pro plan. It includes everything in Pro and Pro+, plus:
- MOMO Gamma
- Aura AI Trade Advisor and Aura AI Agents
- MOMO ORB
- Additional time-stacking columns
- Keyword news filtering and triggers
- Added Stream, Discovery and News panes
FAQs about MOMO Gamma
What is GEX in stocks?
GEX, or gamma exposure, estimates how much market makers will need to buy or sell a stock to stay hedged as its price moves. It is built from each strike's gamma times open interest times 100, with puts counted as negative.
What is a gamma flip?
The price where total dealer gamma changes from positive to negative. Above it, dealer hedging tends to dampen moves. Below it, hedging tends to speed them up.
Which expirations does MOMO Gamma use?
The nearest three expirations plus the next monthly, for strikes within 40% of the current price. This often requires analyzing hundreds of strikes across the options chain.
MOMO Gamma is a research tool and is not investment advice. Gamma levels describe how options positioning may affect price; they do not predict it. Trading is risky and can include the loss of significant capital. The SPY and AAPL readings above are from the MOMO Pro app after the close on Friday, Nov 20, 2026.