
Introducing MOMO Gamma - Changing our Rules to Bring Insight into Options Impact

The US Options market is no longer a stock market "side bet". In terms of notional value, it is a force to be recognized. In 2025, the options market is on track for 13.8 billion contracts, marking the 6th consecutive year of record volume. This has resulted in more capital "exposure" changes hands via derivatives than via actual share ownership on many trading days.
This trend has created the need for better insight into if and how the underlying options market will impact your common stock trades. While we maintain a position of price on common being the truest indicator - and crystallization of all knowledge at a given point in time, if the underlying has significant strike volume, it is necessary to incorporate this knowledge accordingly.
For this reason we have introduced MOMO Gamma - a tool to provide statistical influence into the impact gamma exposure (GEX) can have on a trade.
MOMO Gamma works by ingesting all the strikes within a 30 day range where options gamma has the greatest impact. (Gamma, for the most part on expiries more than 14 days has a much lower influence to price action vs. near term expirations.). Once captured, MOMO Gamma processes the current options chain data to determine the gamma impact and likely influence on price action.
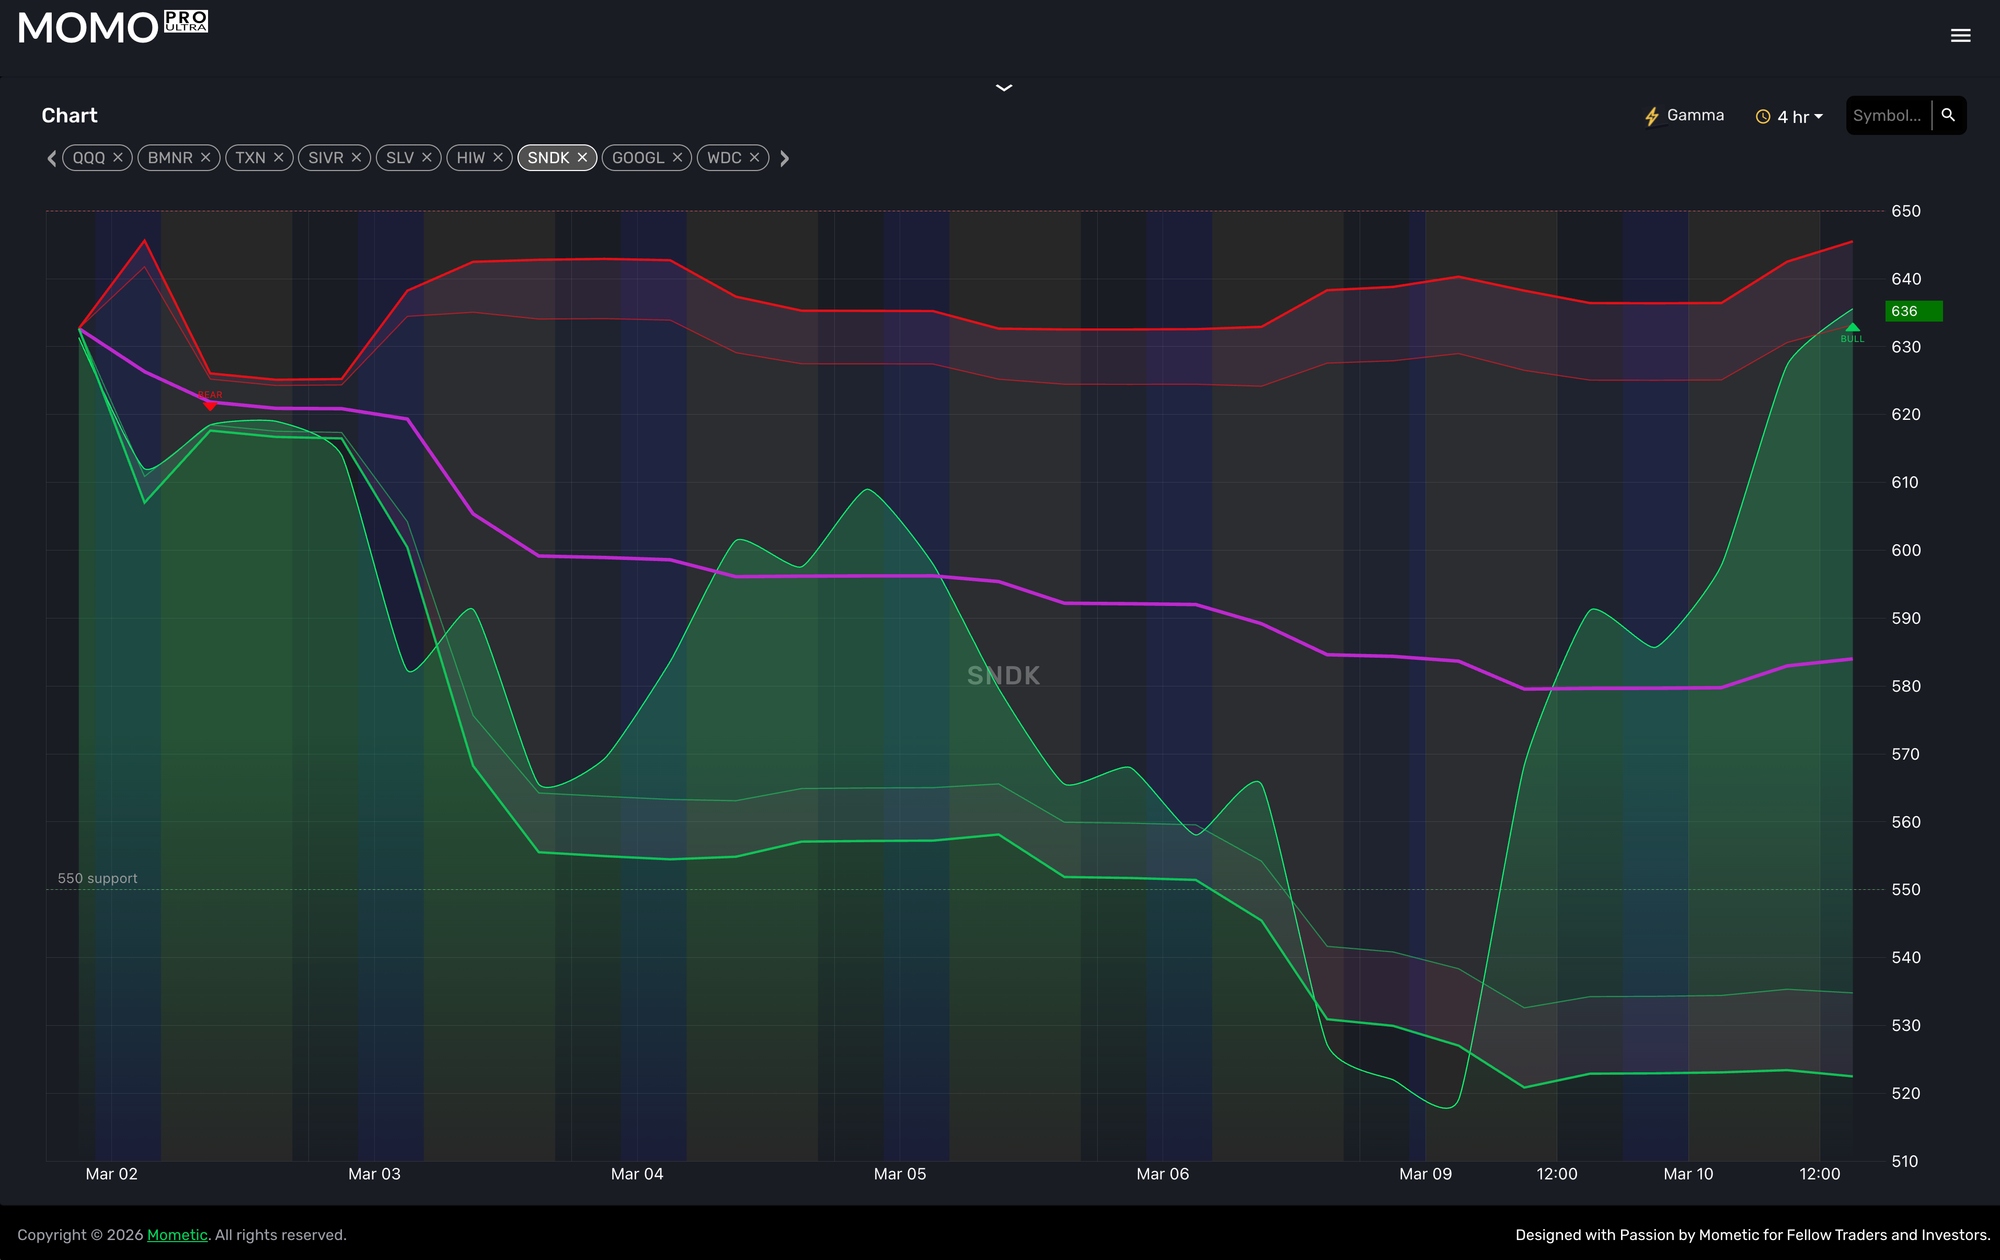
After analyzing we visually print the gamma levels: Resistance (Call Wall), Major Wall (Magnet), and Support (Put Wall) on our charts.
Additionally, we show buy/sell triggers as well as VWAP-based statistical boundaries. Why? Well, in an options heavy symbol, dealers need to accumulate common to support their positions and hedge. Dealers are evaluated and paid on how much better they can accumulate positions vs. VWAP. These ranges are where they will support the price and as such is a much stronger metric than say Bollinger bands when measuring dealers.
This degree of institutional insight is unique in our space giving traders a much richer view of what is going to happen practically regardless of most common moves. Its showing what the dealers need to make happen to support the market structure.
But most importantly, there are trades here that statistically can be played as institutions need to hedge their gamma and its very mechanical. When it happens you can quickly profit based on these signals.
The result of this 5-year shift has resulted in heavy Dealer Gamma Positioning.
- Stickiness: When dealers are "Long Gamma" (typically during slow rallies), their hedging suppresses volatility, pinning the market in tight ranges (VIX suppression).
- Fragility: When dealers flip "Short Gamma" (during sharp sell-offs), they must sell into selling, exacerbating downsides. The 2020-2025 period has seen Volmageddon 2.0 fears, but the market has largely absorbed the volume because 0DTEs expire so fast that the risk "resets" every day at 4:15 PM ET.
Coupled with our existing realtime analytics and streams you get a one-stop platform for uncovering breakouts and validating strength and likely stops which are invisible in standard screeners.
We added Gamma for these reasons. I've personally had my neck cranked on more than one occasion from the invisible hand of the options market. Existing tools only muddy the story and over-complicate the challenge, typically also at an incredible monthly cost. MOMO Gamma is in its early stages, but will bring increased awareness and improved entries for day trading and confidence to hold swings during periods of volatility.
Don't have MOMO Pro Ultra yet? Get started here!